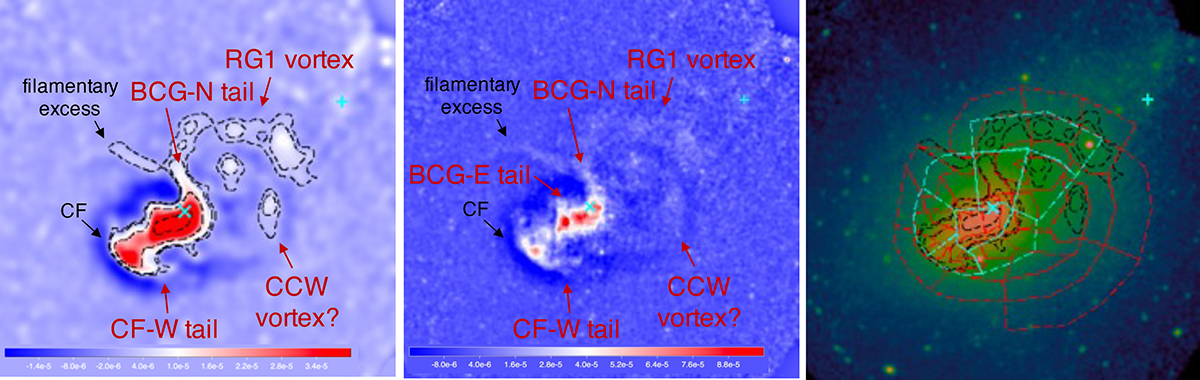
Fig. 3.
Download original image
Left: Close up of the cluster center. Same image as shown in Fig. 2, which is focused on the cluster center, with the field of view indicated by the magenta rectangle in Fig. 2. It is overlaid with the black contours of 2, 10, 50, and 150σ with respect to the rms noise. Middle: Unsharp masked image created by subtracting images smoothed with σ = 3″ and σ = 60″, presented to show fine structures. Right: Same image as shown in Fig. 1. Red polygons indicate the regions selected in the analysis of the thermodynamic and abundance maps discussed in Sect. 3.2. Cyan polygons indicate the regions selected in the line-of-sight bulk-velocity measurements discussed in Sect. 5.
Current usage metrics show cumulative count of Article Views (full-text article views including HTML views, PDF and ePub downloads, according to the available data) and Abstracts Views on Vision4Press platform.
Data correspond to usage on the plateform after 2015. The current usage metrics is available 48-96 hours after online publication and is updated daily on week days.
Initial download of the metrics may take a while.