Open Access
Fig. B.1.
Download original image
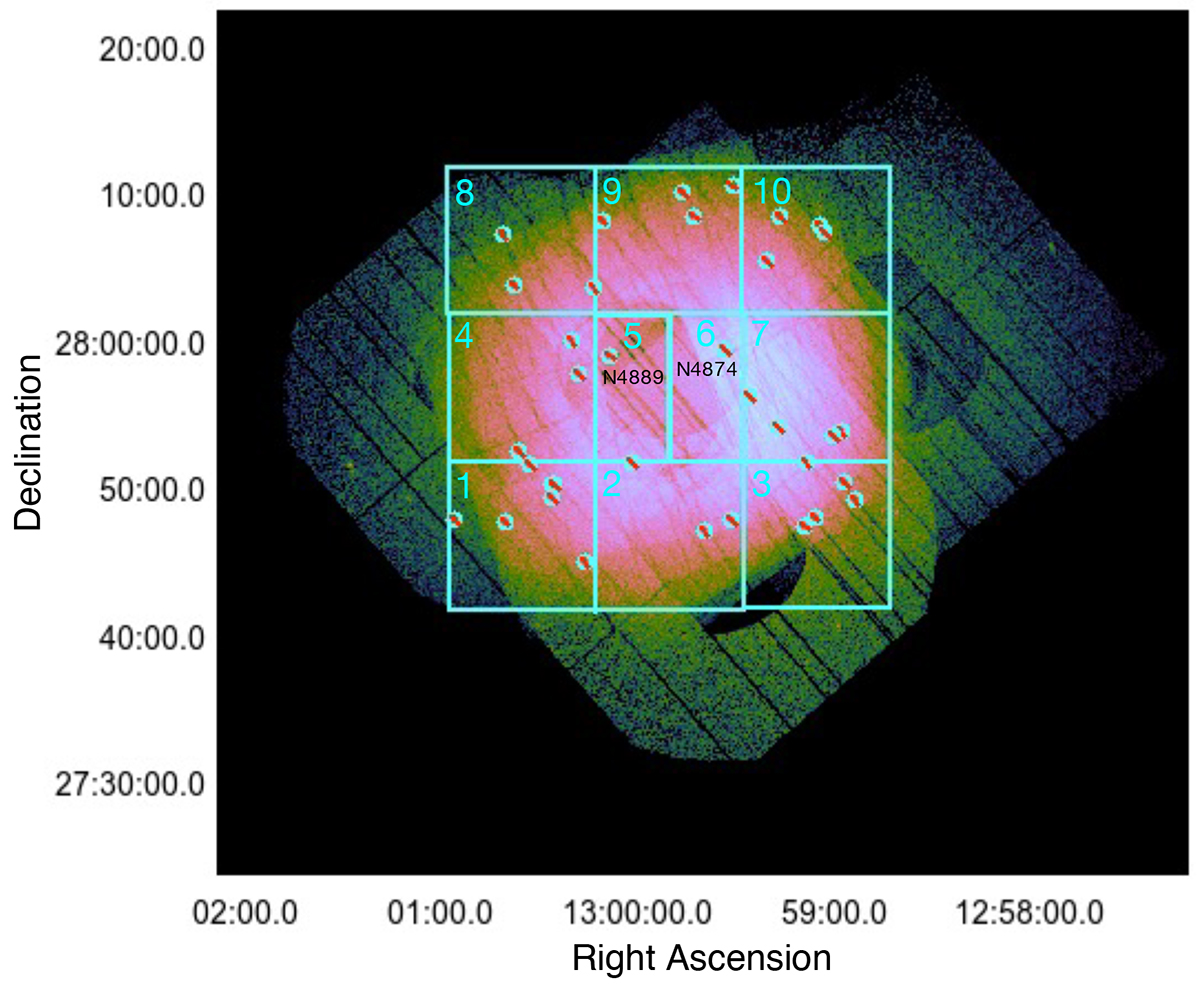
The mosaic count image without the Cu hole in the Coma cluster. The energy range is 0.5-10.0 keV. The rectangles in cyan show the examined regions, which were divided according to Sanders et al. (2020). The circles indicate the point sources excluded in our analysis.
Current usage metrics show cumulative count of Article Views (full-text article views including HTML views, PDF and ePub downloads, according to the available data) and Abstracts Views on Vision4Press platform.
Data correspond to usage on the plateform after 2015. The current usage metrics is available 48-96 hours after online publication and is updated daily on week days.
Initial download of the metrics may take a while.