Fig. A.3.
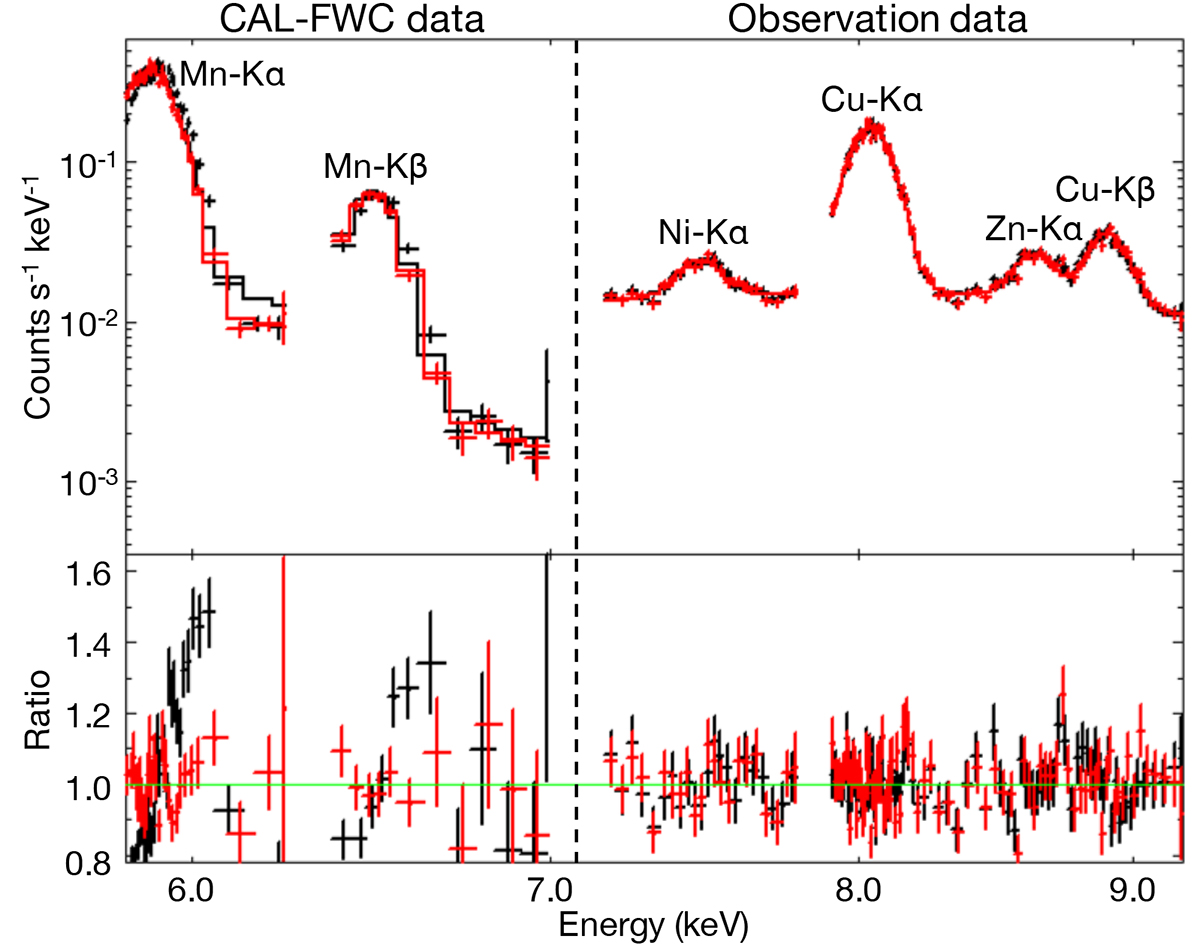
Download original image
An example of the spectrum in the CAL-FWC data and the observation data after the second-order correction. The position of the emission line in the fitting model is fixed at the theoretical value. Red points indicate spectra with the third-order correction applied, in which the energy scale deviations are corrected by a compression model based on the Cu-Kα line.
Current usage metrics show cumulative count of Article Views (full-text article views including HTML views, PDF and ePub downloads, according to the available data) and Abstracts Views on Vision4Press platform.
Data correspond to usage on the plateform after 2015. The current usage metrics is available 48-96 hours after online publication and is updated daily on week days.
Initial download of the metrics may take a while.