Fig. 8.
Download original image
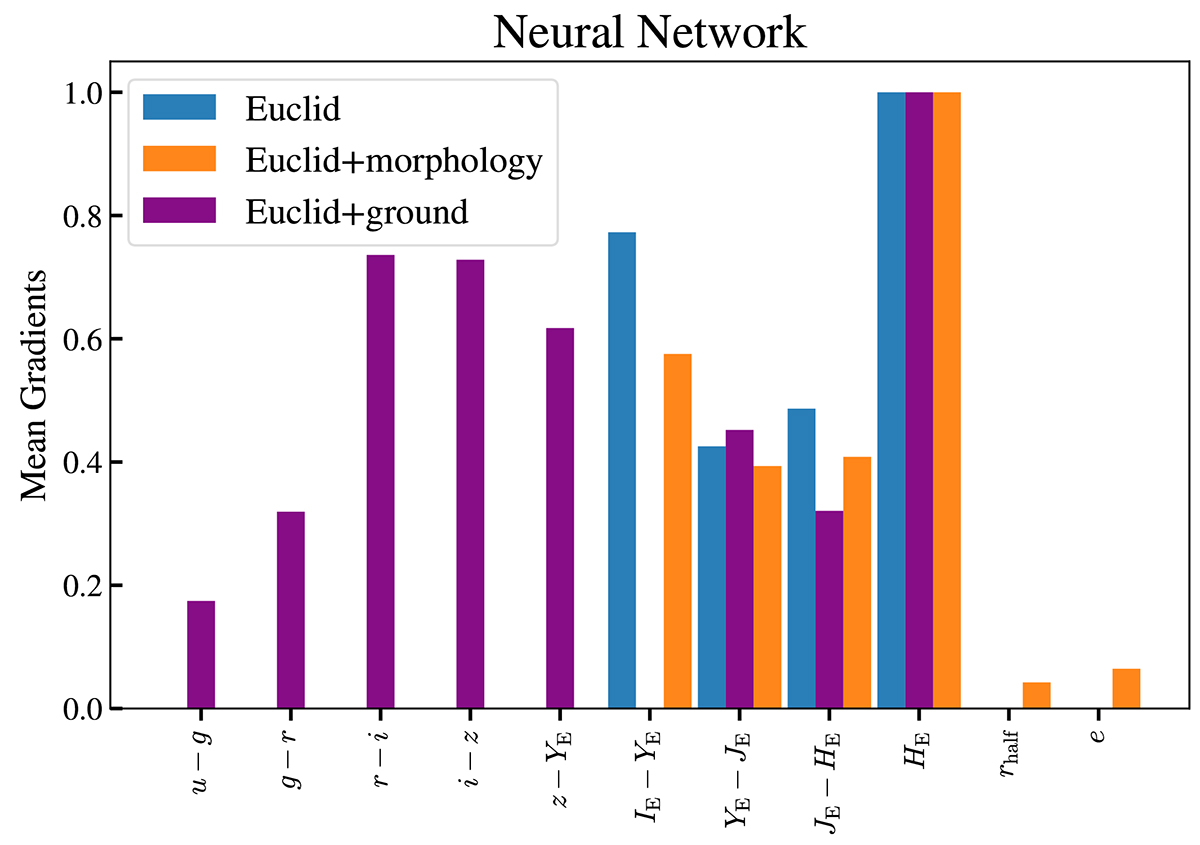
Mean gradients of the neural network output as a function of the input for the three training configurations. In blue, orange, and purple are respectively plotted the mean gradients of the neural networks trained with Euclid photometry, Euclid photometry and morphology, and Euclid and ground-based photometry. All gradients have been normalised to that corresponding to the Euclid HE magnitude.
Current usage metrics show cumulative count of Article Views (full-text article views including HTML views, PDF and ePub downloads, according to the available data) and Abstracts Views on Vision4Press platform.
Data correspond to usage on the plateform after 2015. The current usage metrics is available 48-96 hours after online publication and is updated daily on week days.
Initial download of the metrics may take a while.