Fig. 4.
Download original image
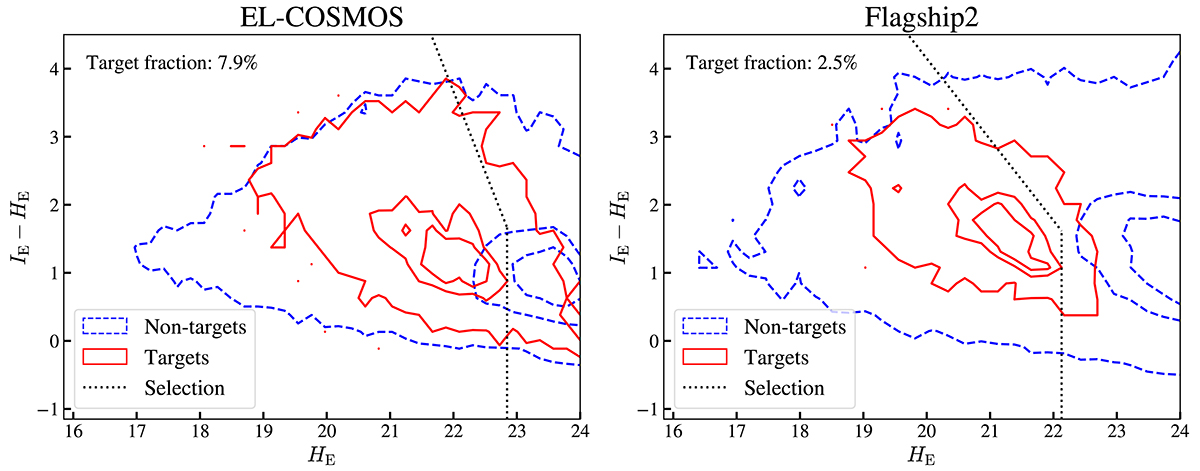
Optimised colour selection in the (IE − HE) vs. HE colour-magnitude plane for EL-COSMOS and Flagship2. The blue dashed lines correspond to the non-target distribution and the solid red lines to the target distribution. The contours contain 99%, 50%, and 25% of the samples. The dotted black segments represent an optimised colour cut in this plane corresponding to a recall value of ∼95%.
Current usage metrics show cumulative count of Article Views (full-text article views including HTML views, PDF and ePub downloads, according to the available data) and Abstracts Views on Vision4Press platform.
Data correspond to usage on the plateform after 2015. The current usage metrics is available 48-96 hours after online publication and is updated daily on week days.
Initial download of the metrics may take a while.