Fig. 3.
Download original image
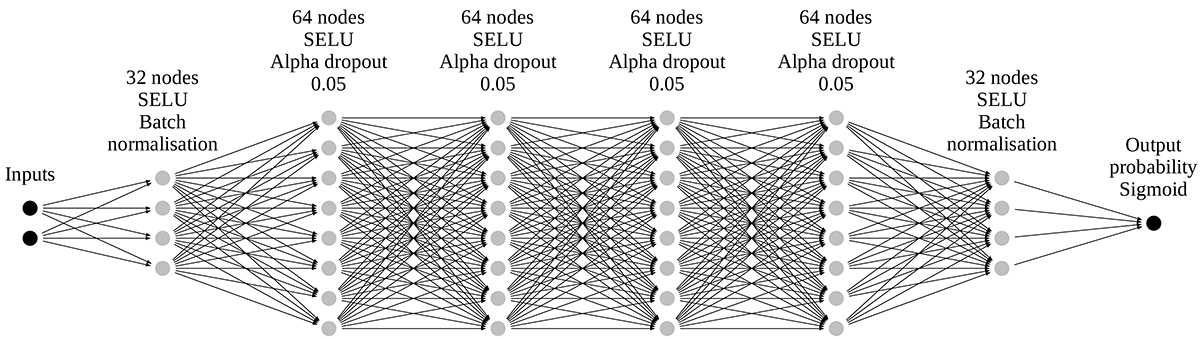
Schematic representation of the neural network architecture used for classification. Values pass from the input to the output along the connected edges; each node represents a linear combination of the inputs and the application of a non-linear activation function. The value at the output represents the binary classification probability between 0 and 1. The number of input neurons varies for the different configurations (4 for Euclid-only, and 8 after adding ground-based photometry; see Sect. 4). For visualisation, the number of neurons in each hidden layer has been divided by 4.
Current usage metrics show cumulative count of Article Views (full-text article views including HTML views, PDF and ePub downloads, according to the available data) and Abstracts Views on Vision4Press platform.
Data correspond to usage on the plateform after 2015. The current usage metrics is available 48-96 hours after online publication and is updated daily on week days.
Initial download of the metrics may take a while.