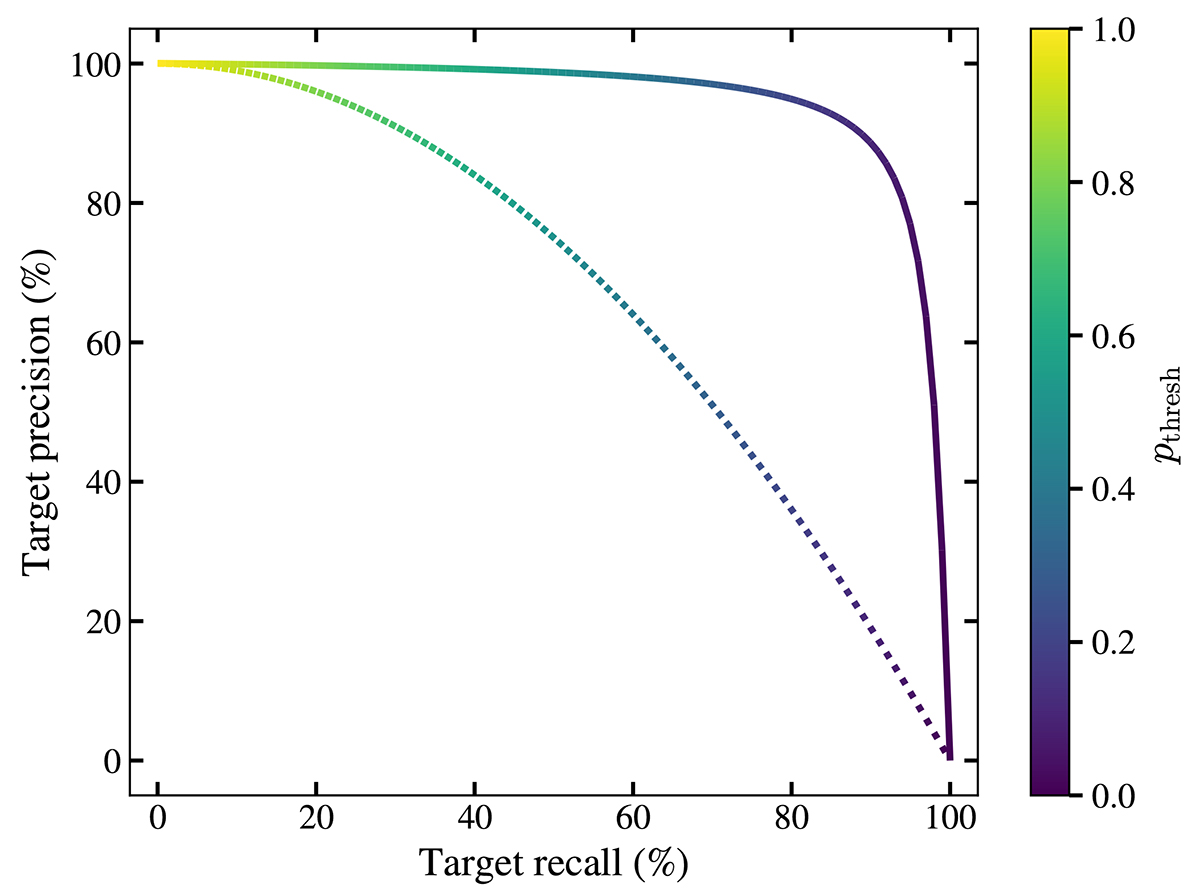
Fig. 2.
Download original image
Relationship between precision and recall of a classifier. The lines are colour-coded as a function of the classification probability threshold. The solid and dotted lines show the behaviour of two classifiers for illustration. The classifier represented by the solid line performs better than that represented by the dotted line since it gives higher precision and recall.
Current usage metrics show cumulative count of Article Views (full-text article views including HTML views, PDF and ePub downloads, according to the available data) and Abstracts Views on Vision4Press platform.
Data correspond to usage on the plateform after 2015. The current usage metrics is available 48-96 hours after online publication and is updated daily on week days.
Initial download of the metrics may take a while.