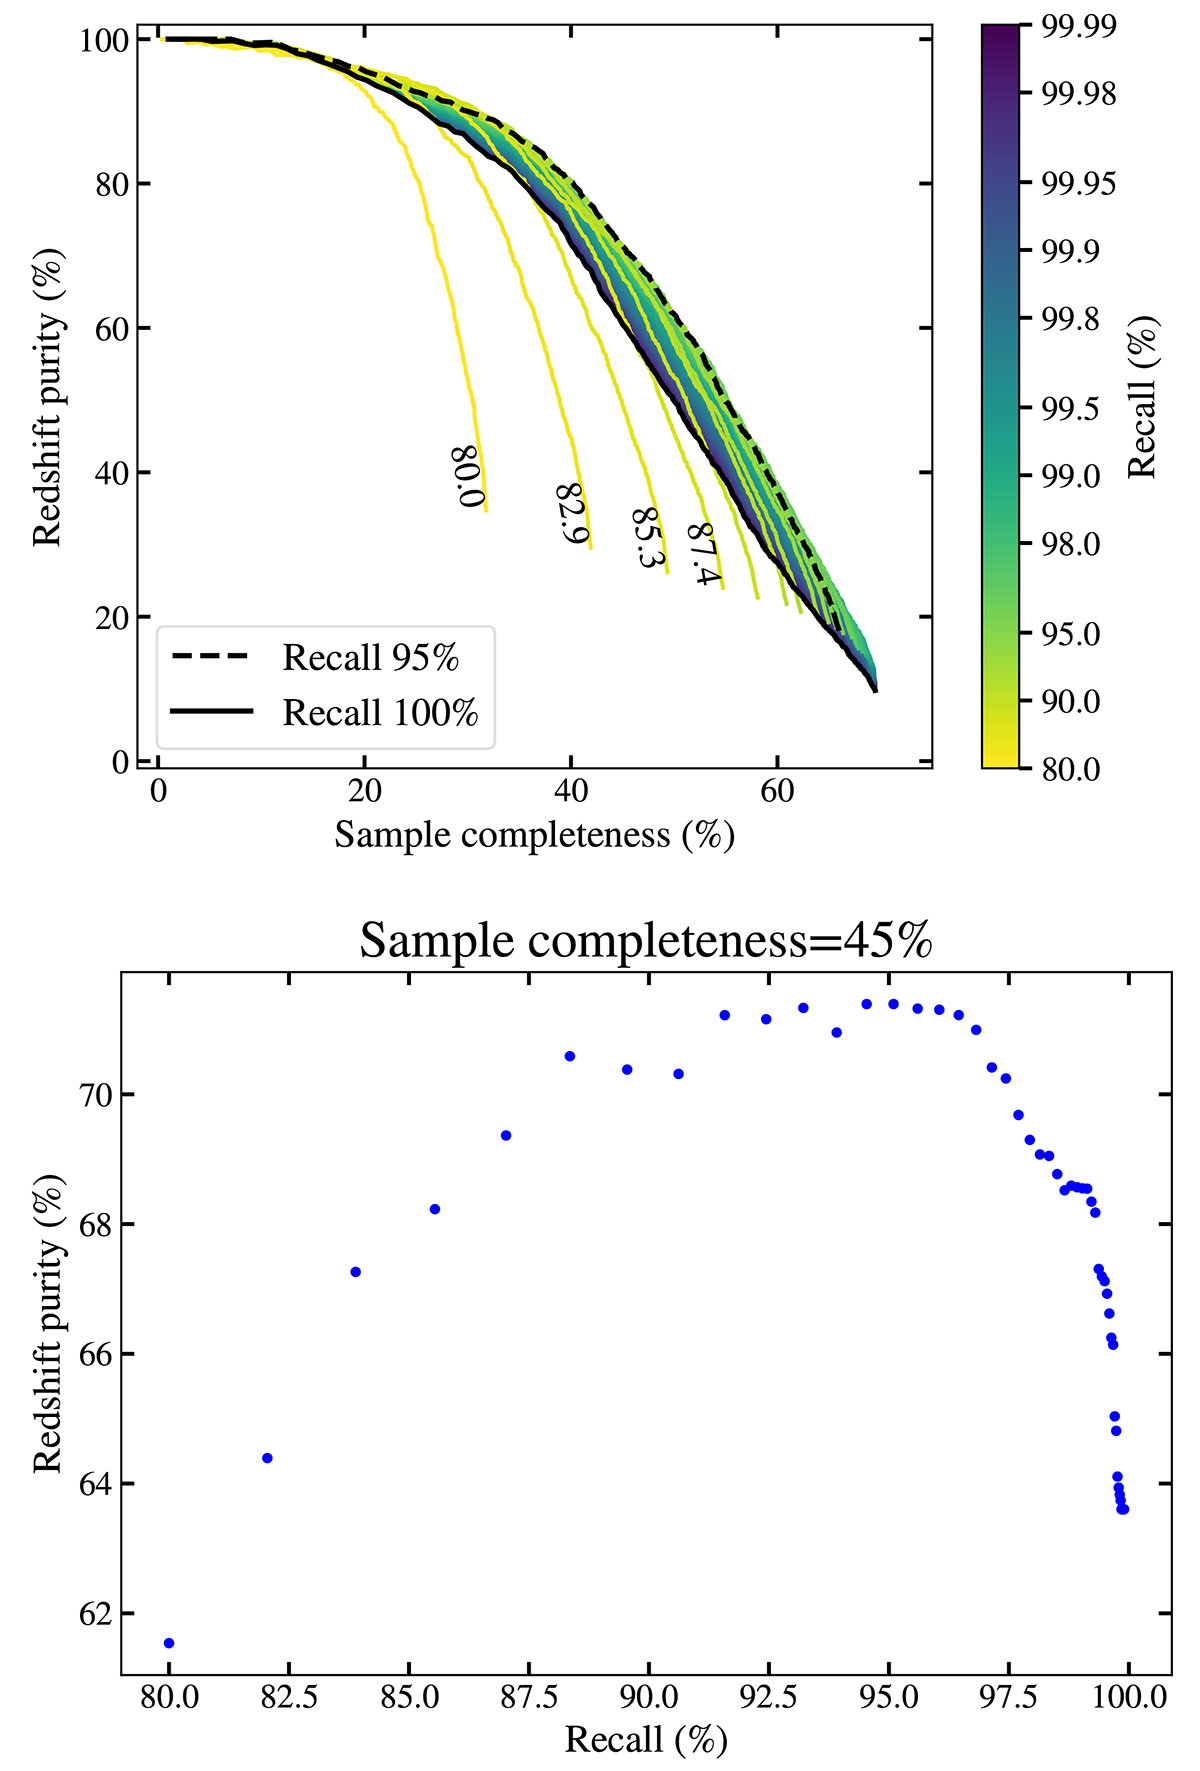
Fig. 12.
Download original image
Spectroscopic redshift purity and completeness with the addition of the photometric classification. Top: Curves are colour-coded as a function of the recall of the photometric classification. The spectroscopic reliability threshold varies along each curve, while varying the threshold on the photometric classification probability shifts the curve. The purity improves as recall increases, reaching a maximum for recall ∼95% and declining after. For better visualisation, the first lines are labelled with the corresponding recall value. At recall values above 95% the curves are tightly packed. The solid black line corresponds to 100% recall, while the dashed line to 95% recall, the value we chose to benchmark our results. Bottom: Redshift purity as a function of the recall of the photometric classification, fixing the value of sample completeness to 45%.
Current usage metrics show cumulative count of Article Views (full-text article views including HTML views, PDF and ePub downloads, according to the available data) and Abstracts Views on Vision4Press platform.
Data correspond to usage on the plateform after 2015. The current usage metrics is available 48-96 hours after online publication and is updated daily on week days.
Initial download of the metrics may take a while.