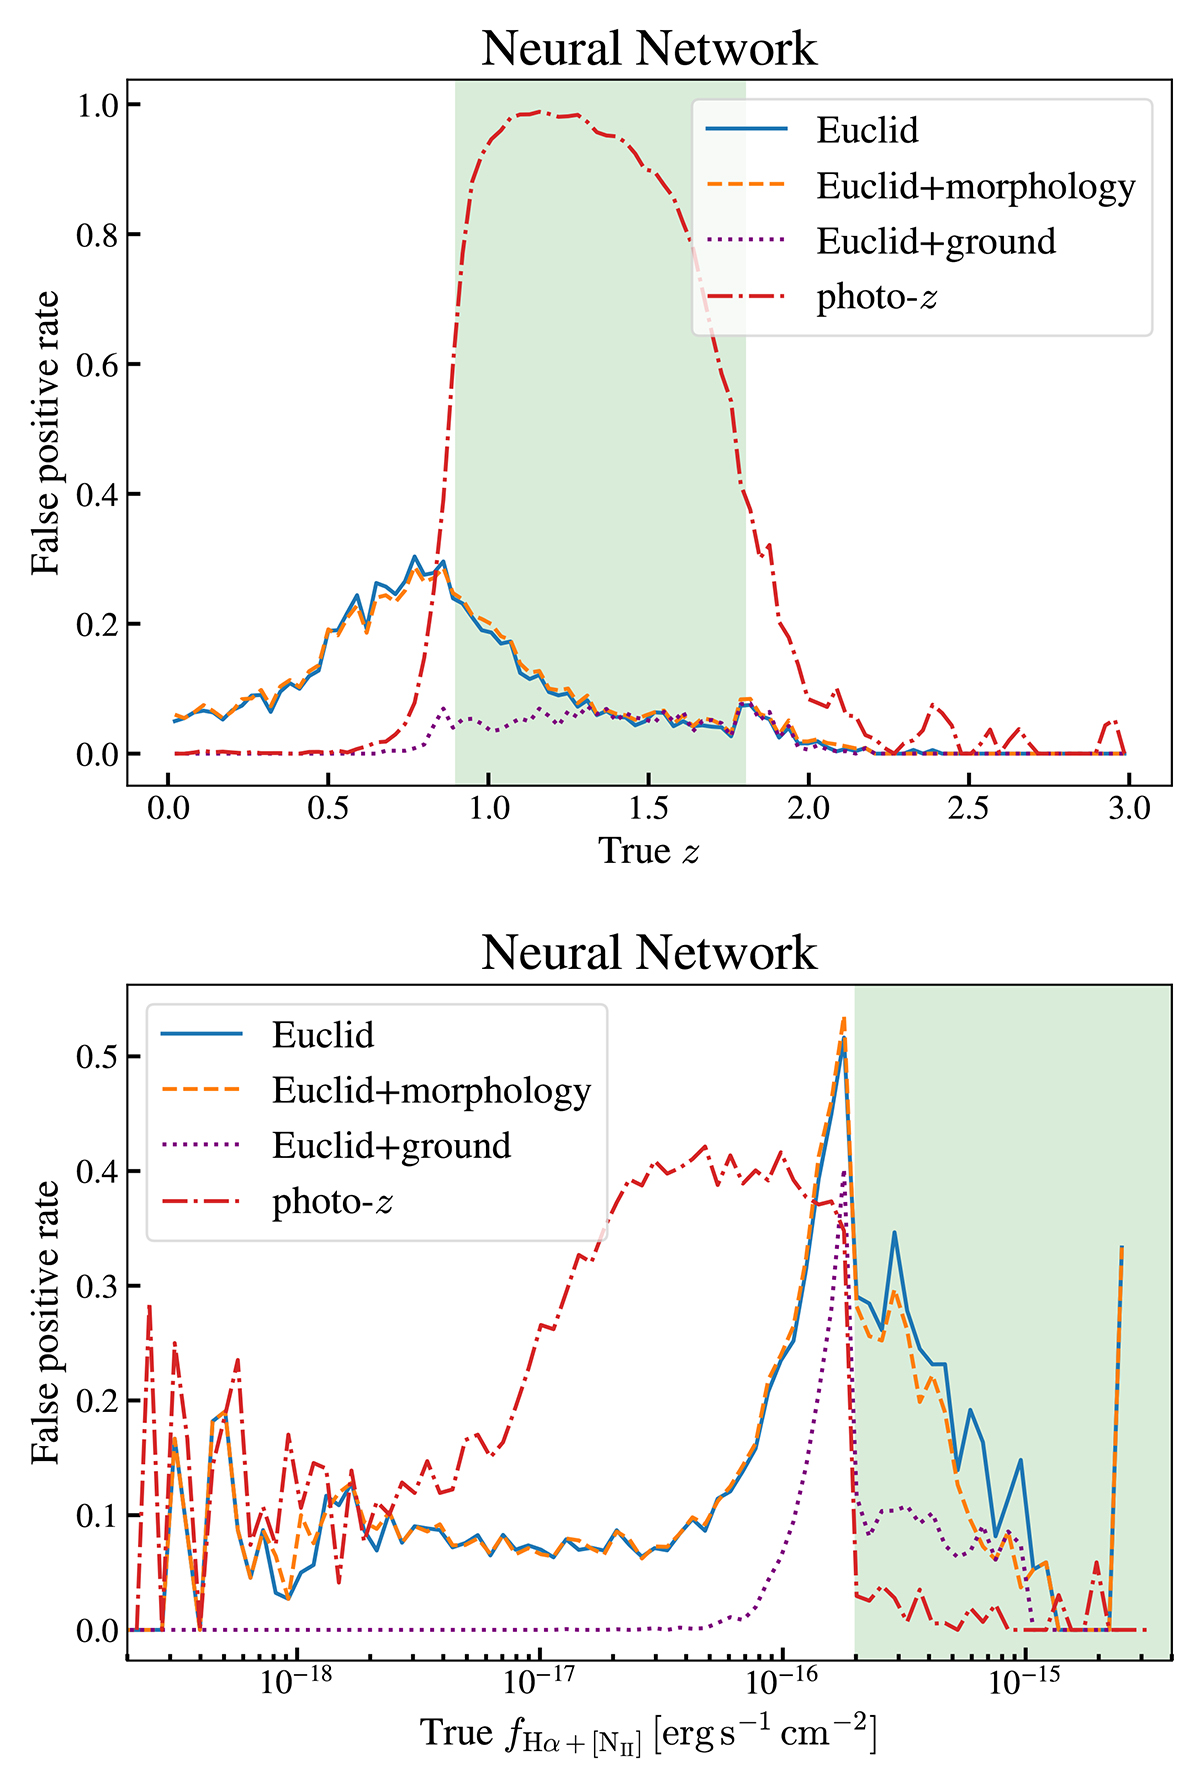
Fig. 10.

Download original image
False positive rate as functions of redshift and fHα+[N II] for Flagship2. The plot allows us to identify the origin of non-targets that enter the selected samples. The solid blue, dashed orange, and dotted purple curves, respectively, correspond to the neural networks trained with Euclid photometry, Euclid plus morphological data, and Euclid plus ground-based photometry. The dash-dotted red line is the false positive rate of the photo-z selection. Top: False positive rate as a function of z. The green shaded area marks the target redshift range. Bottom: False positive rate as a function of fHα+[N II]. The green shaded area corresponds to the Hα limiting flux. There is a peak in the false positive rate just below the flux limit used to define the target sample, although we note that these galaxies can still give correct redshift measurements.
Current usage metrics show cumulative count of Article Views (full-text article views including HTML views, PDF and ePub downloads, according to the available data) and Abstracts Views on Vision4Press platform.
Data correspond to usage on the plateform after 2015. The current usage metrics is available 48-96 hours after online publication and is updated daily on week days.
Initial download of the metrics may take a while.


