Fig. 1.
Download original image
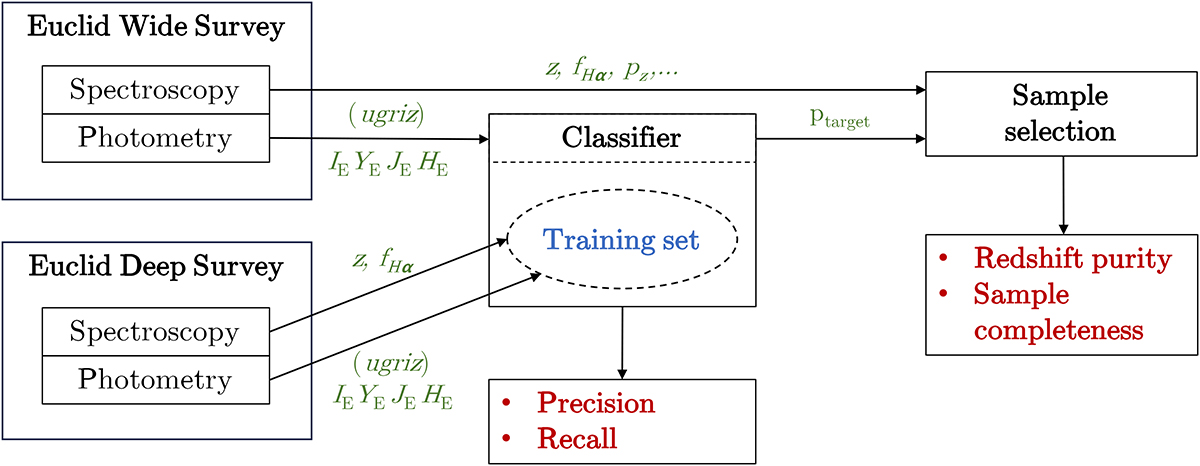
Schematic description of the spectroscopic sample selection pipeline. The flowchart shows where a photometric target selection would be inserted in the spectroscopic selection pipeline. The photometric classifier performance is quantified by its precision and recall (defined in Sect. 2.1), while the final spectroscopic sample is characterised by the redshift purity and sample completeness. In this work, we use mock catalogues for the Euclid Wide and Deep surveys (see Sect. 3).
Current usage metrics show cumulative count of Article Views (full-text article views including HTML views, PDF and ePub downloads, according to the available data) and Abstracts Views on Vision4Press platform.
Data correspond to usage on the plateform after 2015. The current usage metrics is available 48-96 hours after online publication and is updated daily on week days.
Initial download of the metrics may take a while.