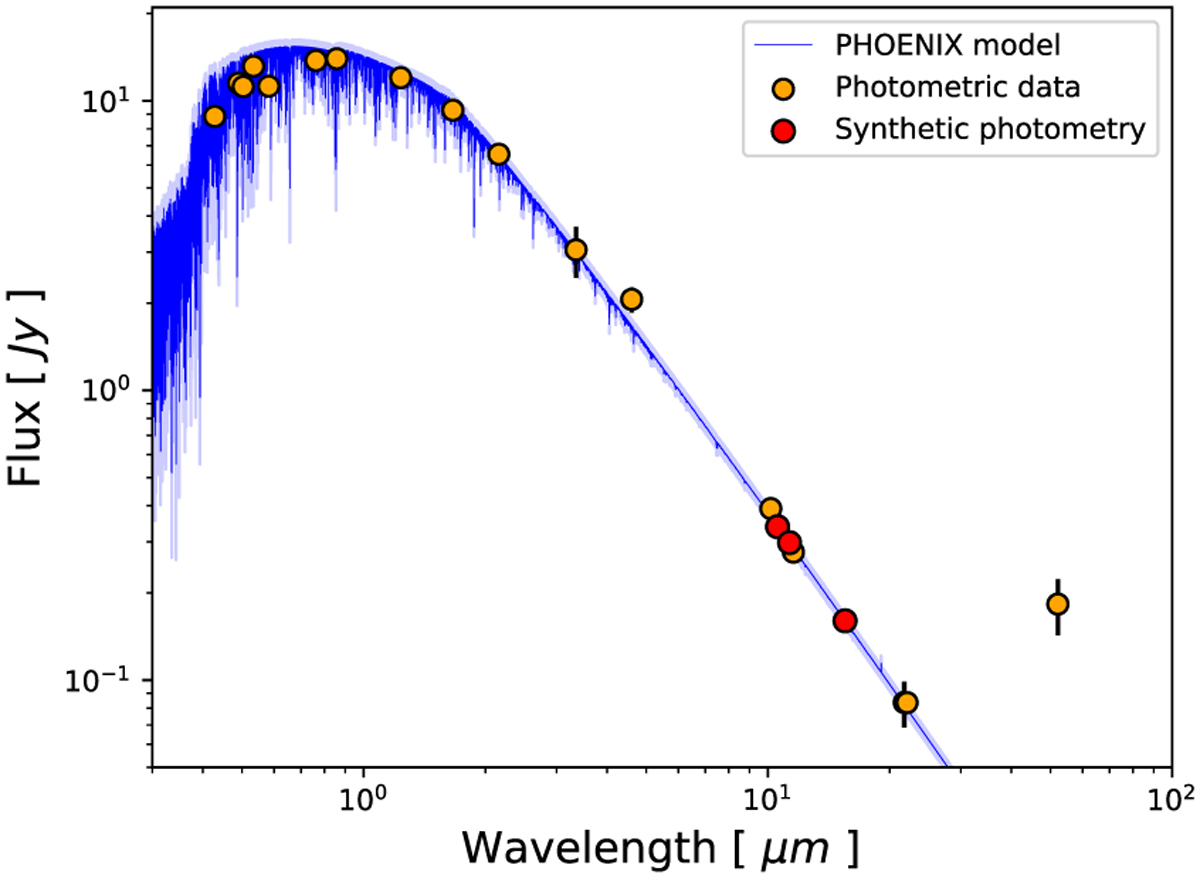
Fig. 5
Download original image
Spectral energy distribution of the star HR 2562. Orange dots correspond to the photometric data from Table 1. Red dots correspond to our synthetic photometry using the F1065C, F1140C, and F1550C bandpasses. The blue line corresponds to the mean between all the realizations of PHOENIX models with the respective uncertainties.
Current usage metrics show cumulative count of Article Views (full-text article views including HTML views, PDF and ePub downloads, according to the available data) and Abstracts Views on Vision4Press platform.
Data correspond to usage on the plateform after 2015. The current usage metrics is available 48-96 hours after online publication and is updated daily on week days.
Initial download of the metrics may take a while.