Fig. 7
Download original image
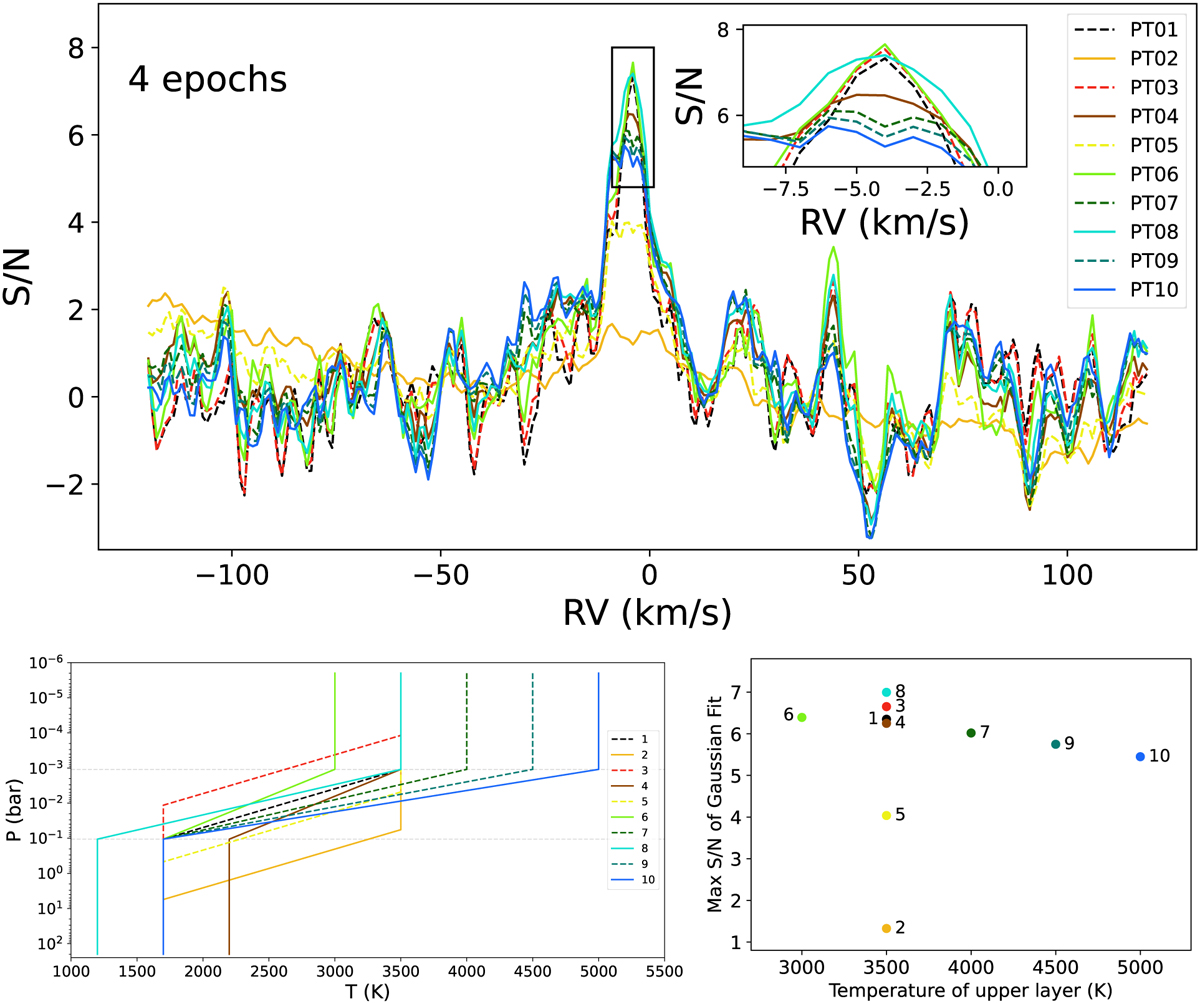
Analysis of the dependence of the iron detection on the model used to compute the CCF. Top: four-epoch co-added CCFs for Fe I computed with different templates that correspond to each P-T profile (bottom left panel). Bottom left: P-T profiles (see also Fig. B.1 and Table B.1). Bottom right: maximum S/N value of Gaussian fit to co-added CCFs of four epochs, computed with the Fe I template corresponding to each P-T profile.
Current usage metrics show cumulative count of Article Views (full-text article views including HTML views, PDF and ePub downloads, according to the available data) and Abstracts Views on Vision4Press platform.
Data correspond to usage on the plateform after 2015. The current usage metrics is available 48-96 hours after online publication and is updated daily on week days.
Initial download of the metrics may take a while.