Fig. 1
Download original image
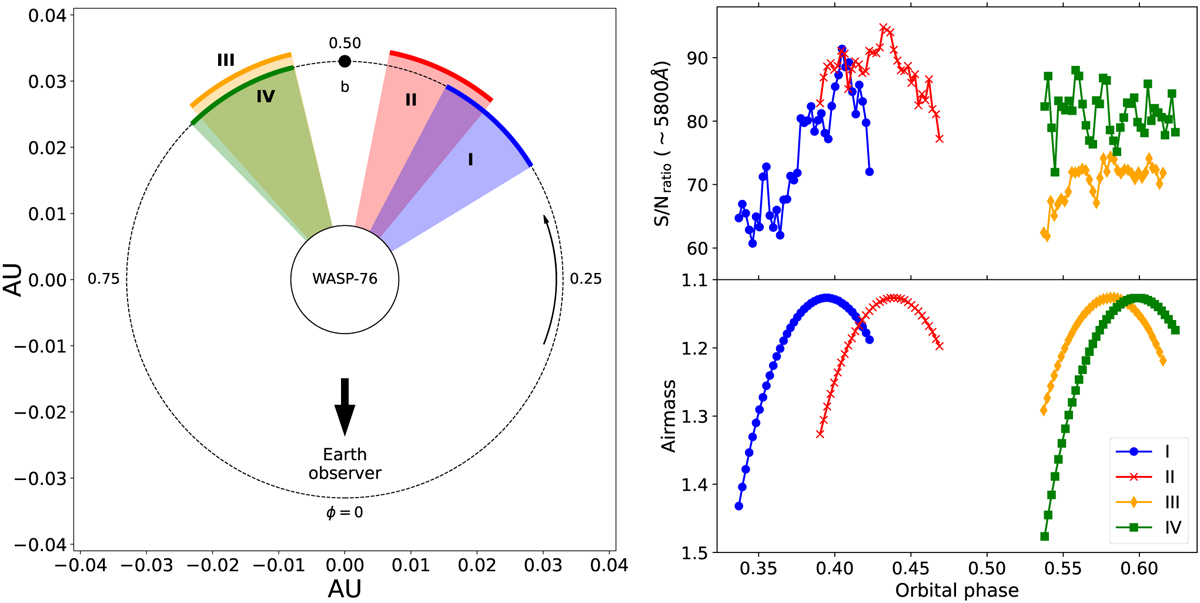
Details of the observations of WASP-76 b with ESPRESSO. Left: orbital diagram of WASP-76 b showing the epochs and phases (ϕ) during which the system was observed. The curved arrow indicates increasing orbital phase for the planet. Right: variation of signal-to-noise ratio around 5800 Å (top) and airmass (bottom) for each epoch observed. See more details in Table 3.
Current usage metrics show cumulative count of Article Views (full-text article views including HTML views, PDF and ePub downloads, according to the available data) and Abstracts Views on Vision4Press platform.
Data correspond to usage on the plateform after 2015. The current usage metrics is available 48-96 hours after online publication and is updated daily on week days.
Initial download of the metrics may take a while.