Fig. 9
Download original image
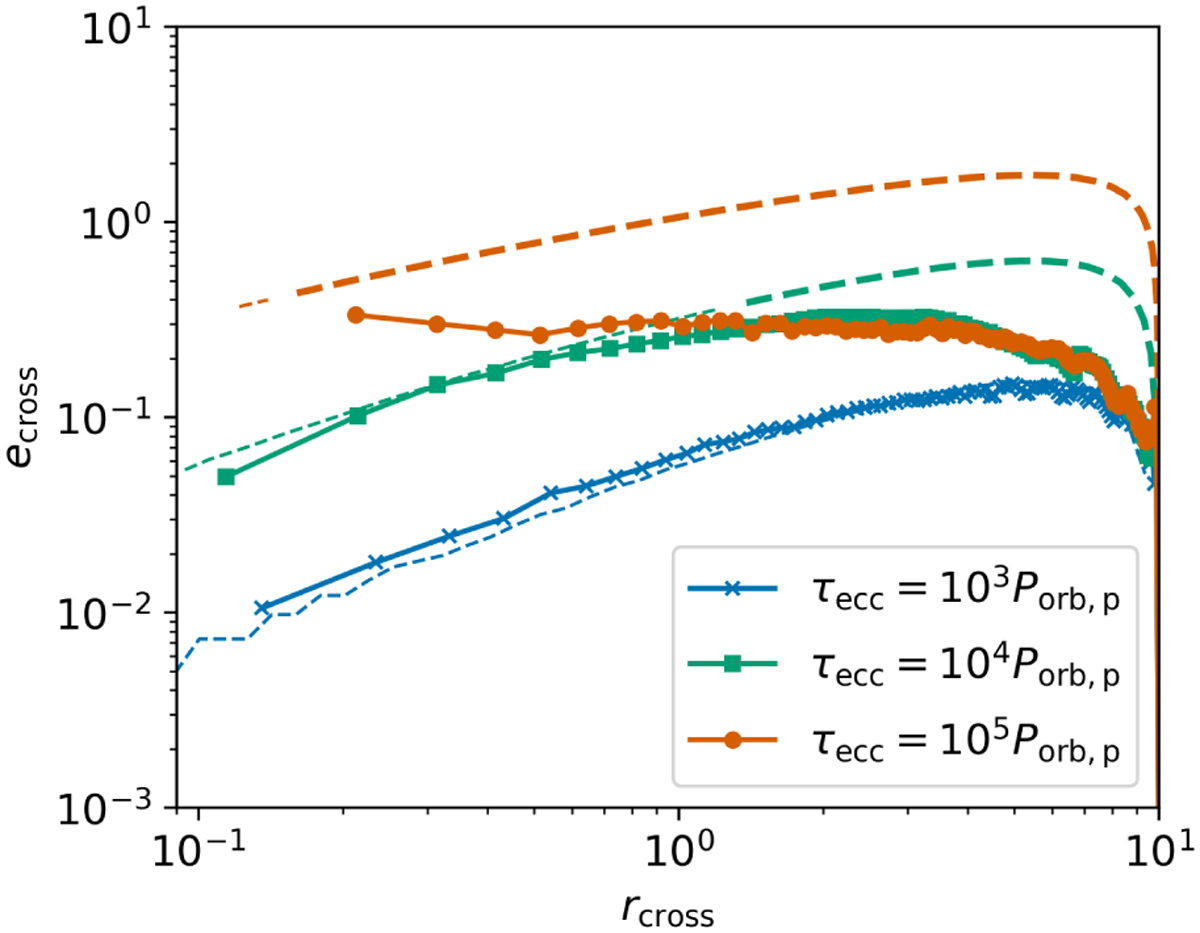
rcross = ap(1 − ecross,p) vs. ecross obtained by the N-body simulations. ecross and ecross,p are calculated by taking the average of eccentricities of planetesimals whose orbits are just before crossing to the planet’s orbit. The dashed lines show ecross obtained from Eqs. (40) and (41). The thick dashed lines mean Eq. (44) is achieved. When Eq. (44) is achieved, ecross becomes smaller than the analytical models predict. As indicated in the legend, the different colors correspond to the different eccentricity excitation timescales τecc.
Current usage metrics show cumulative count of Article Views (full-text article views including HTML views, PDF and ePub downloads, according to the available data) and Abstracts Views on Vision4Press platform.
Data correspond to usage on the plateform after 2015. The current usage metrics is available 48-96 hours after online publication and is updated daily on week days.
Initial download of the metrics may take a while.