Fig. 8
Download original image
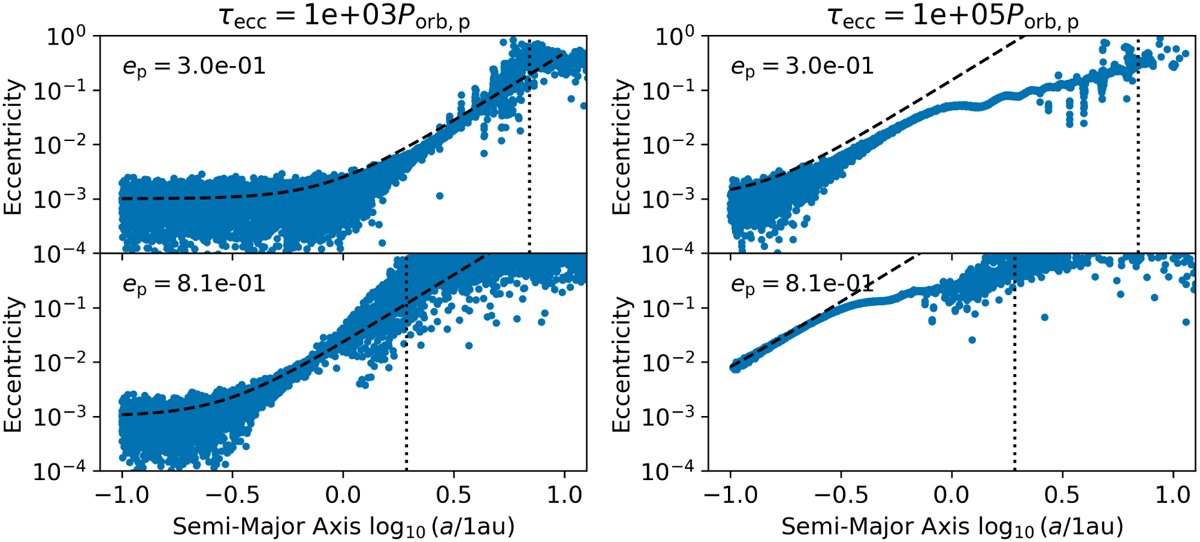
Snapshots of the planetesimal disk when the planet’s eccentricity increases with time. The left and right columns show the cases with τecc = 103 Porb,p and 103 Porb,p, respectively. The upper and lower panels show the snapshots when the planetary eccentricity is ep = 0.3 and 0.81, respectively. The vertical dotted lines are the pericenter and apocenter of the planet. The dashed lines are the analytical models of the planetesimal eccentricity given by Eq. (40). When τecc = 105 Porb,p, the planetesimal eccentricity is smaller than that given by Eq. (40) because the resonances suppress the linear increase of the eccentricity.
Current usage metrics show cumulative count of Article Views (full-text article views including HTML views, PDF and ePub downloads, according to the available data) and Abstracts Views on Vision4Press platform.
Data correspond to usage on the plateform after 2015. The current usage metrics is available 48-96 hours after online publication and is updated daily on week days.
Initial download of the metrics may take a while.