Fig. 7
Download original image
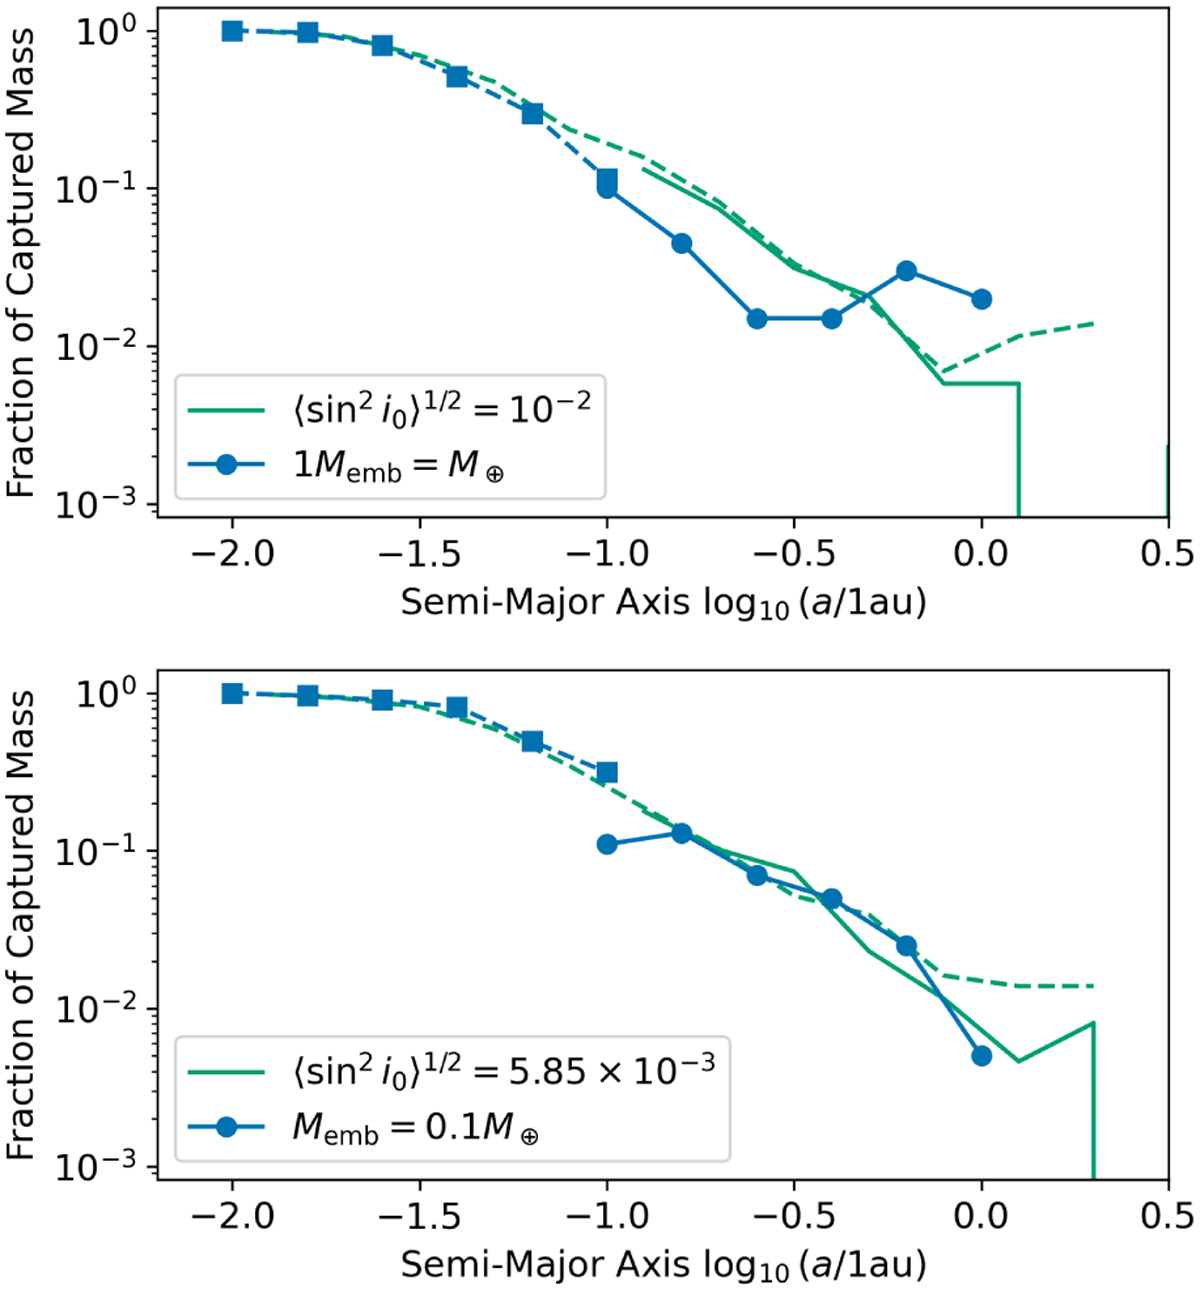
Same as Fig. 4 but with the blue plots showing the results for embryos instead of the planetesimal disk. We use five embryos for each simulation and sum up the collision fraction. The upper panel shows the case with 1 M⊕ embryos, and the lower panel shows the case with 0.1 M⊕ embryos. For comparison, we also plot the results for the planetesimal disk with green lines. The initial inclination of the planetesimal disk is equal to the reduced hill radius of embryos.
Current usage metrics show cumulative count of Article Views (full-text article views including HTML views, PDF and ePub downloads, according to the available data) and Abstracts Views on Vision4Press platform.
Data correspond to usage on the plateform after 2015. The current usage metrics is available 48-96 hours after online publication and is updated daily on week days.
Initial download of the metrics may take a while.