Fig. 6
Download original image
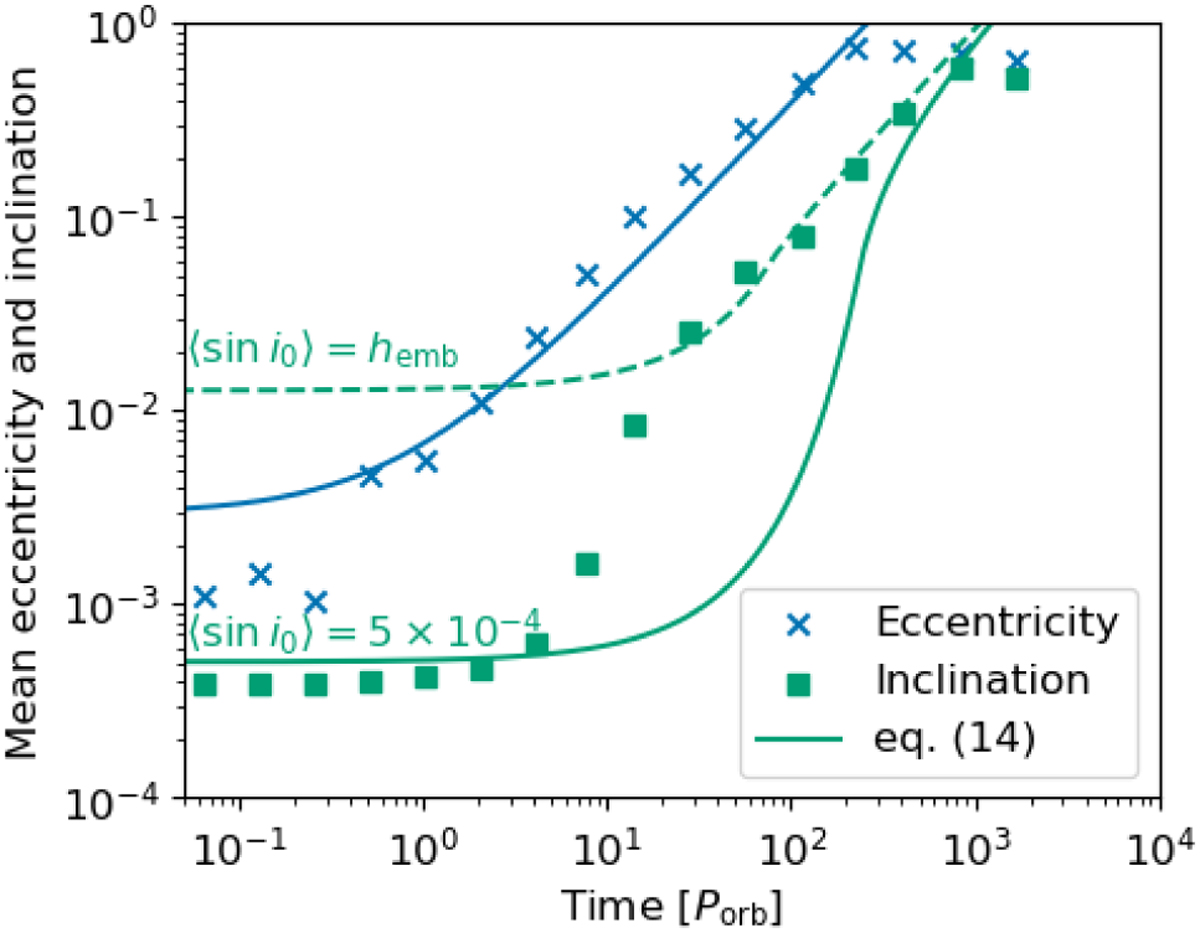
Same as Fig. 1, but using embryos instead of a planetesimal disk. The blue and green plots show the geometrical mean of eccentricities and inclinations of embryos. The blue solid line shows Eq. (5) with ⟨e0⟩ = 1 × 10⁻³. The green solid and dashed lines show Eq. (14) with ⟨sin i0⟩ = 5 × 10⁻⁴ and ⟨sin i0⟩ = hemb, respectively. Here, we show the results of 1 M⊕ embryos around 0.4 au.
Current usage metrics show cumulative count of Article Views (full-text article views including HTML views, PDF and ePub downloads, according to the available data) and Abstracts Views on Vision4Press platform.
Data correspond to usage on the plateform after 2015. The current usage metrics is available 48-96 hours after online publication and is updated daily on week days.
Initial download of the metrics may take a while.