Fig. C.1
Download original image
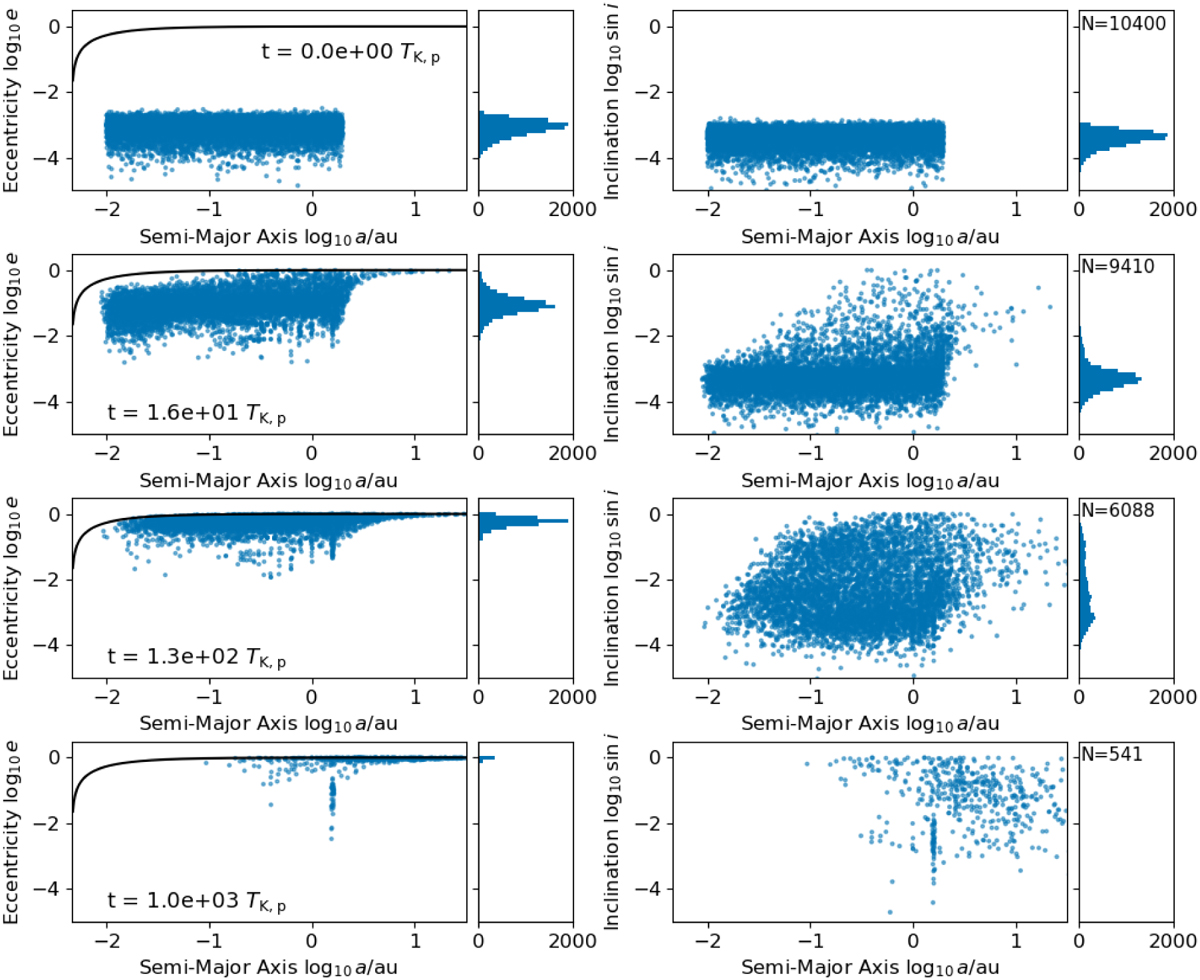
Snapshots of orbital integration around an eccentric giant planet. The left and right columns show the eccentricity and inclination, respectively, with the semi-major axis of planetesimals. Time progresses from upper to lower panels. The solid lines in the left column show efall. The small boxes on the right side of each panel show the histogram. The total number of planetesimals N is written in the boxes. Here, we show the case with ap = 1 au, ep = 0.99, sin ip = 0, Mp = MJup and Rp = RJup.
Current usage metrics show cumulative count of Article Views (full-text article views including HTML views, PDF and ePub downloads, according to the available data) and Abstracts Views on Vision4Press platform.
Data correspond to usage on the plateform after 2015. The current usage metrics is available 48-96 hours after online publication and is updated daily on week days.
Initial download of the metrics may take a while.