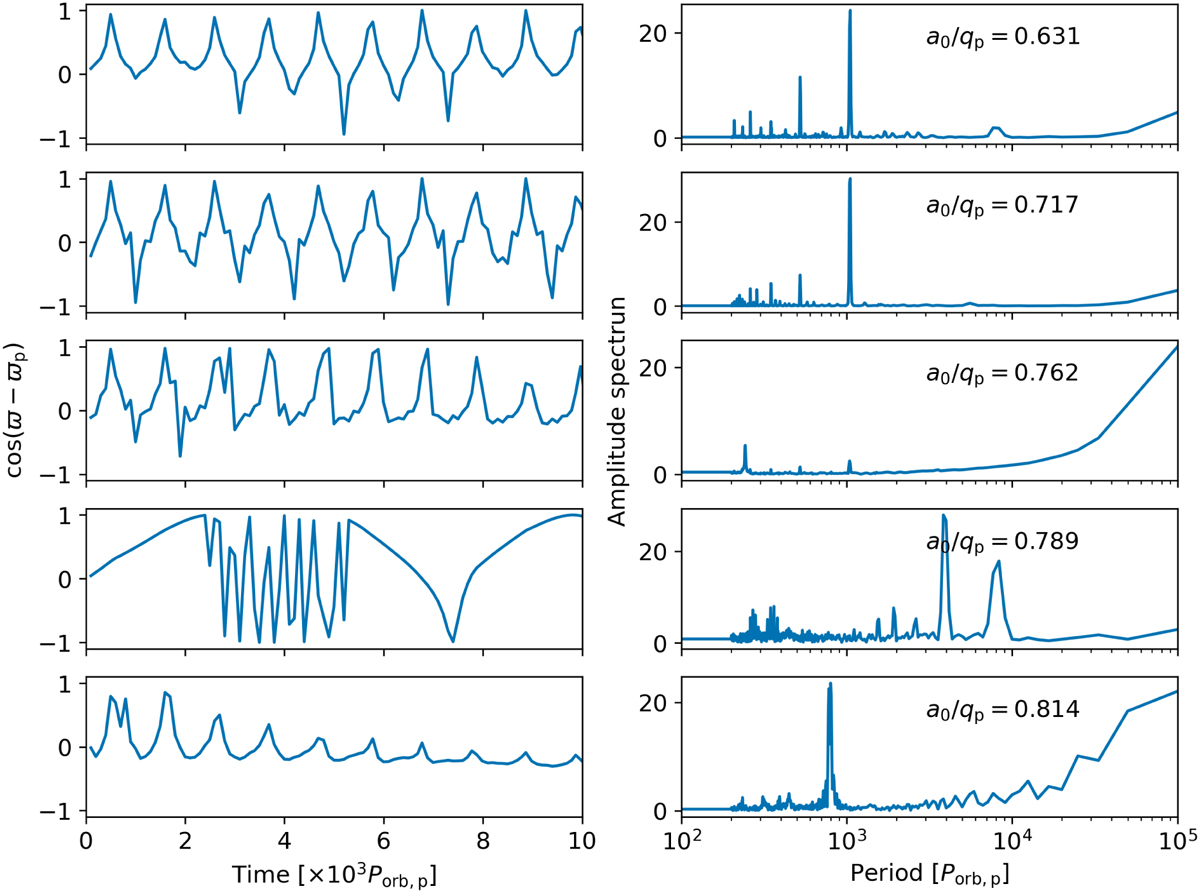
Fig. B.2
Download original image
Left columns: Time evolution of sin(ϖ − ϖp) for each planetesimal. Right columns: Amplitude spectrum obtained with Fast Fourier Transform. The amplitude spectrum is scaled with N/2, where N is the number of data points. Each planetesimal has a different initial semi-major axis, and it is shown in the upper right corner of the panels in the right column divided by the pericenter of the planet qp = 5 au.
Current usage metrics show cumulative count of Article Views (full-text article views including HTML views, PDF and ePub downloads, according to the available data) and Abstracts Views on Vision4Press platform.
Data correspond to usage on the plateform after 2015. The current usage metrics is available 48-96 hours after online publication and is updated daily on week days.
Initial download of the metrics may take a while.