Open Access
Fig. A.1
Download original image
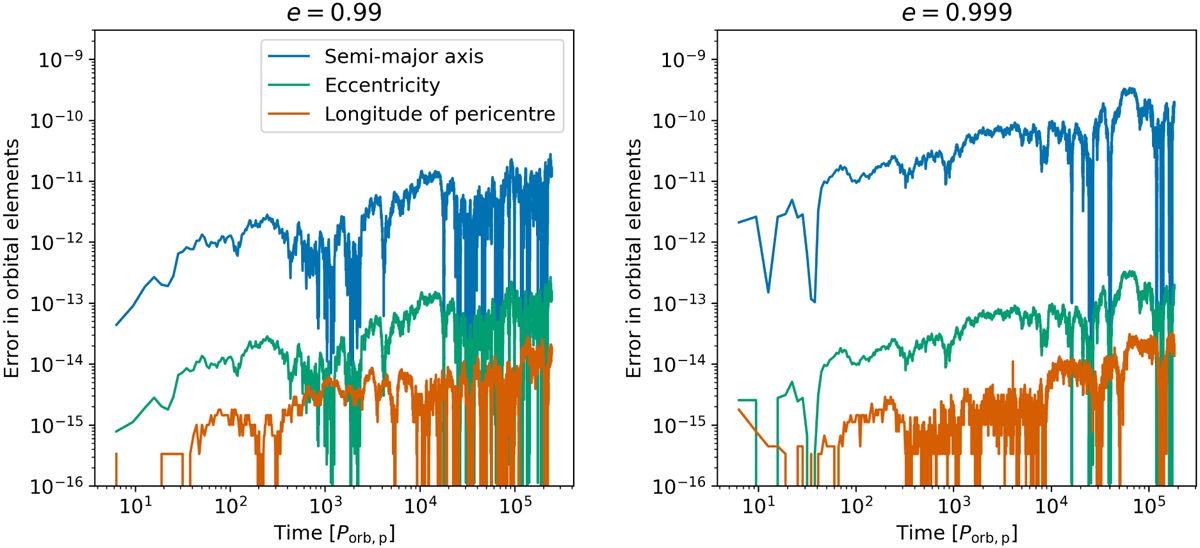
Time evolution in the errors of orbital elements. Blue, green, and orange lines show the error in the semi-major axis, eccentricity, and longitude of the pericentre, respectively.
Current usage metrics show cumulative count of Article Views (full-text article views including HTML views, PDF and ePub downloads, according to the available data) and Abstracts Views on Vision4Press platform.
Data correspond to usage on the plateform after 2015. The current usage metrics is available 48-96 hours after online publication and is updated daily on week days.
Initial download of the metrics may take a while.