Fig. 12
Download original image
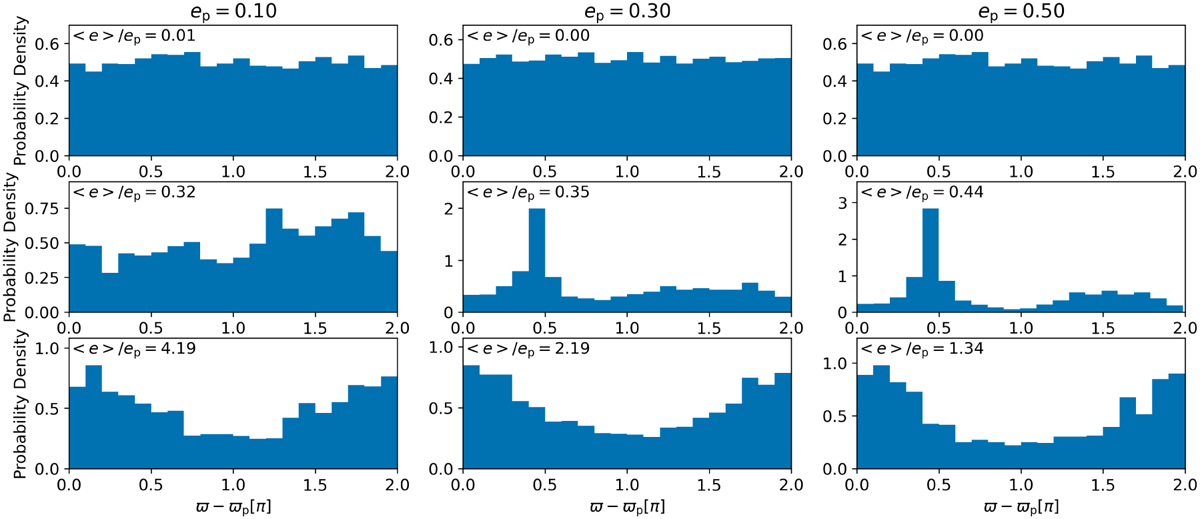
Distribution of ϖ − ϖp around an eccentric planet. We plot the cases of ep = 0.1, 0.3, and 0.5 in the left, center, and right columns, respectively. The upper, middle, and lower panels show different times. The mean eccentricities of planetesimals divided by the planetary eccentricity are indicated in the upper left corner of each panel. Once ⟨e⟩ exceeds ep, the planetesimals’ orbits start to align to the planetary orbit.
Current usage metrics show cumulative count of Article Views (full-text article views including HTML views, PDF and ePub downloads, according to the available data) and Abstracts Views on Vision4Press platform.
Data correspond to usage on the plateform after 2015. The current usage metrics is available 48-96 hours after online publication and is updated daily on week days.
Initial download of the metrics may take a while.