Fig. 7.
Download original image
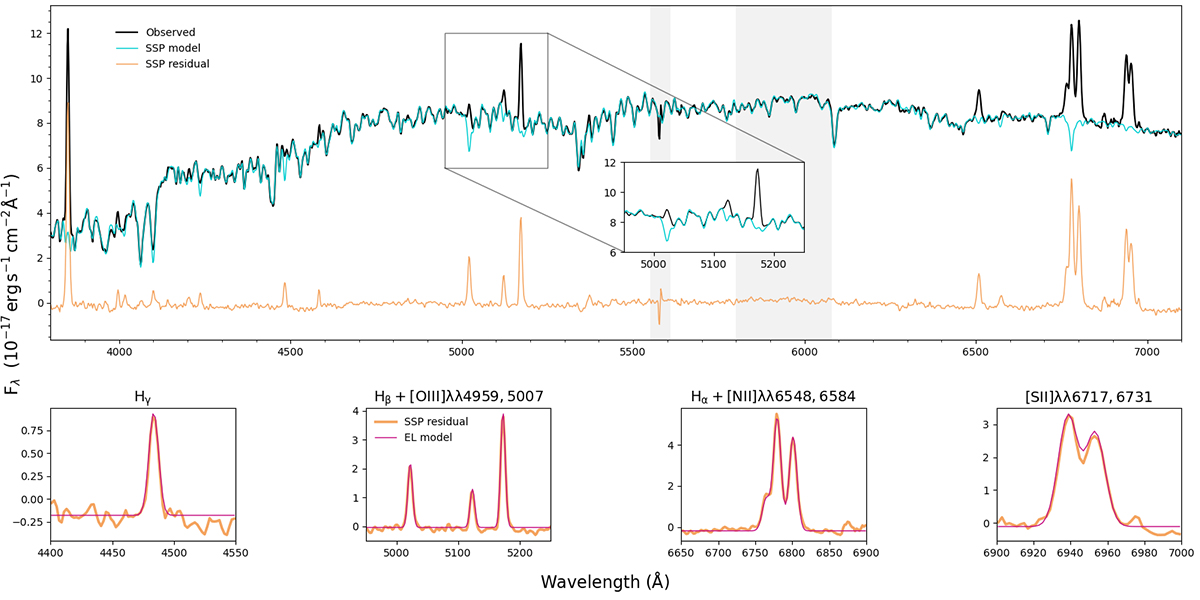
Example of a pyPipe3D fit to the central spectrum (5″ diameter) of CAVITY49137 extracted from the IFS datacube. In the top panel, the black line represents the original spectrum, along with the best fitted stellar population (SSP model, cyan). The pure emission line spectrum after subtracting the best stellar population model is shown as a solid yellow line (SSP residual). The inset is focused on the Hβ-[OIII] spectral region to highlight the quality of the fit. The vertical shaded regions indicate the wavelength ranges masked during the fitting process. The bottom panels show some examples of emission line fittings (emission line (EL) model, red line).
Current usage metrics show cumulative count of Article Views (full-text article views including HTML views, PDF and ePub downloads, according to the available data) and Abstracts Views on Vision4Press platform.
Data correspond to usage on the plateform after 2015. The current usage metrics is available 48-96 hours after online publication and is updated daily on week days.
Initial download of the metrics may take a while.