Open Access
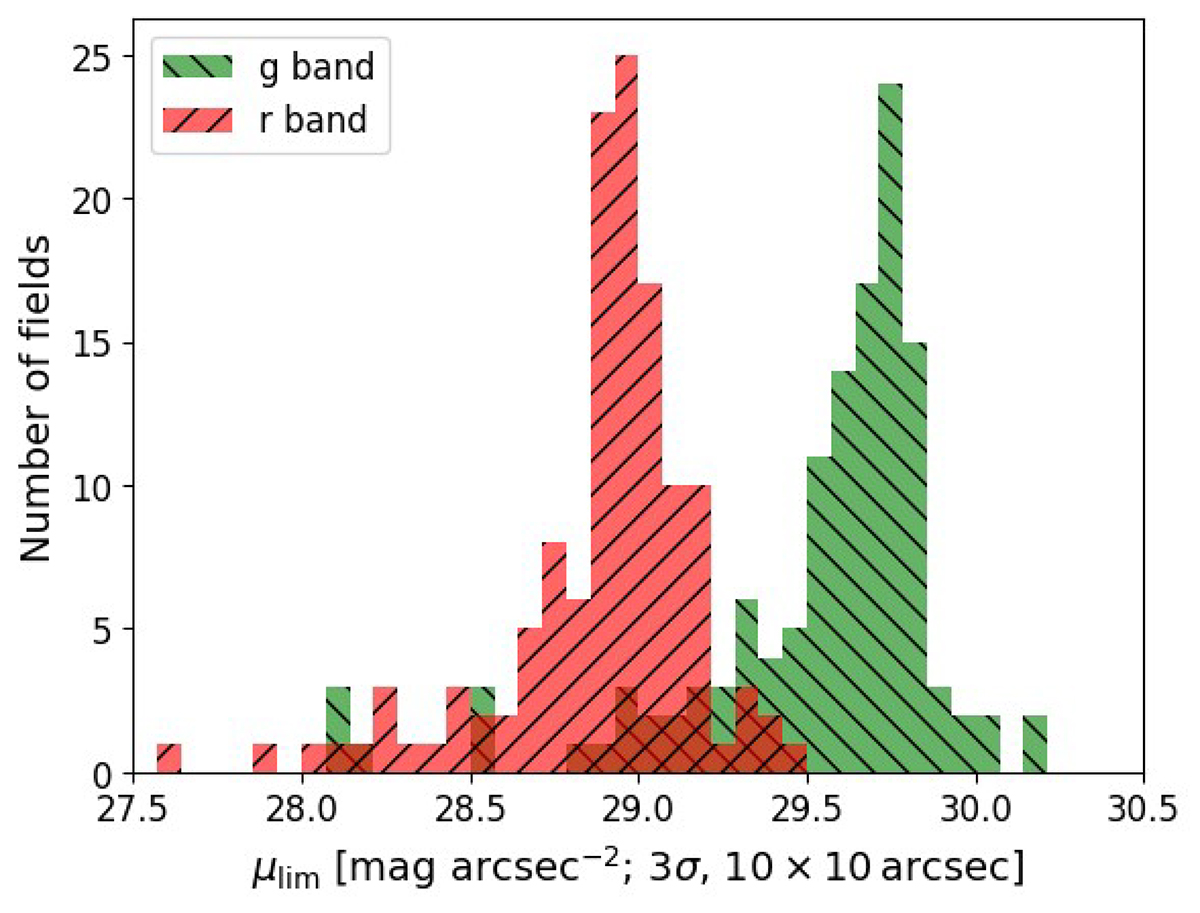
Fig. 5.
Download original image
Histogram of SB limits in optical g and r bands measured at 3σ in 10 × 10 arcsec boxes for the INT data (for details on the procedure see Román et al. 2020).
Current usage metrics show cumulative count of Article Views (full-text article views including HTML views, PDF and ePub downloads, according to the available data) and Abstracts Views on Vision4Press platform.
Data correspond to usage on the plateform after 2015. The current usage metrics is available 48-96 hours after online publication and is updated daily on week days.
Initial download of the metrics may take a while.