Fig. 4.
Download original image
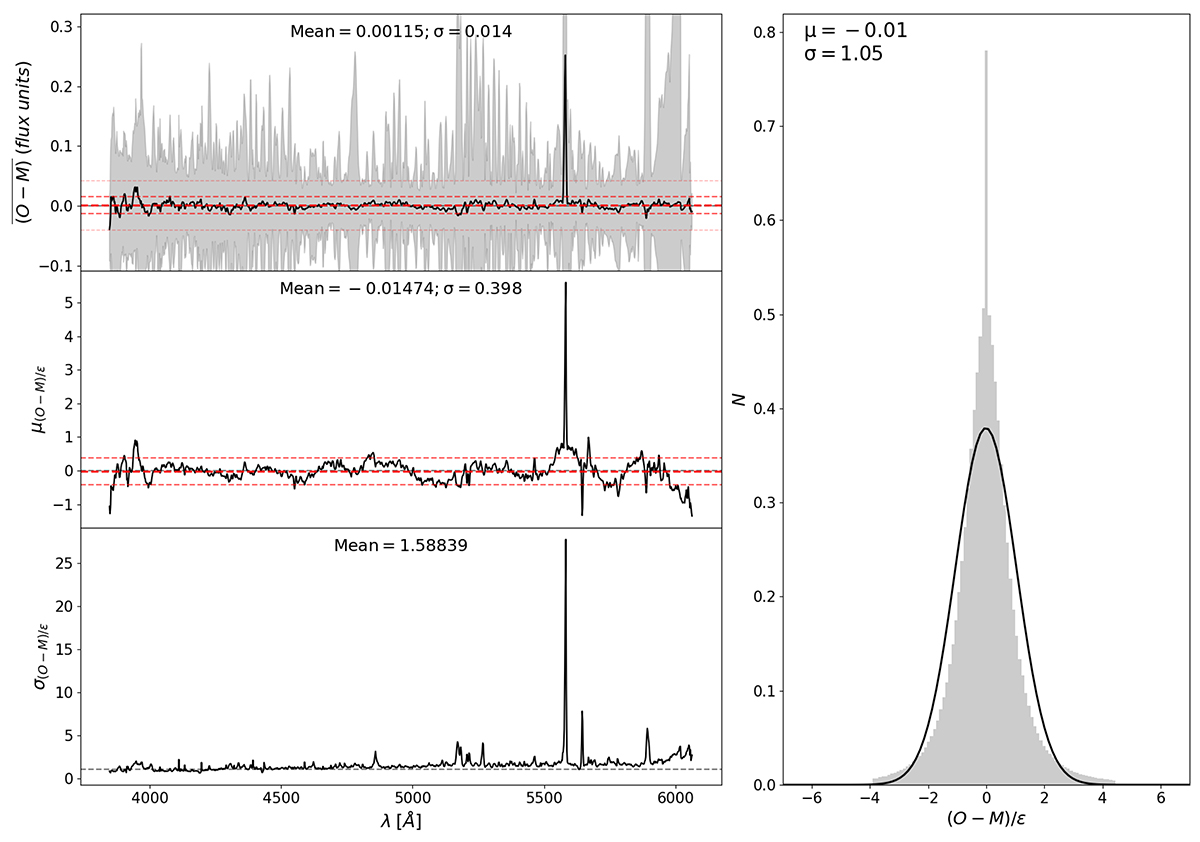
Comparison between the full spectrum fitting residuals and propagated errors in the CAVITY datacubes using a Voronoi spatial binning scheme. Top-left panel: Residual spectrum averaged over all Voronoid bins and all the CAVITY galaxies analysed. Middle-left panel: Mean of the ratio between the residuals and the propagated errors ((O − M)/ϵ) as a function of wavelength. Bottom-left panel: Dispersion of (O − M)/ϵ as a function of wavelength. Right panel: Global distribution of the (O − M)/ϵ. Red horizontal lines of gradual thickness are plotted in each panel for the mean value, mean ±σ, and mean ±3σ. A Gaussian distribution representative of the mean and dispersion of the (O − M)/ϵ distribution is represented in the right-hand panel. In this analysis regions flagged as bad by the reduction pipeline have been masked from each individual spectrum as well as the 5577 Å sky line.
Current usage metrics show cumulative count of Article Views (full-text article views including HTML views, PDF and ePub downloads, according to the available data) and Abstracts Views on Vision4Press platform.
Data correspond to usage on the plateform after 2015. The current usage metrics is available 48-96 hours after online publication and is updated daily on week days.
Initial download of the metrics may take a while.