Fig. 3.
Download original image
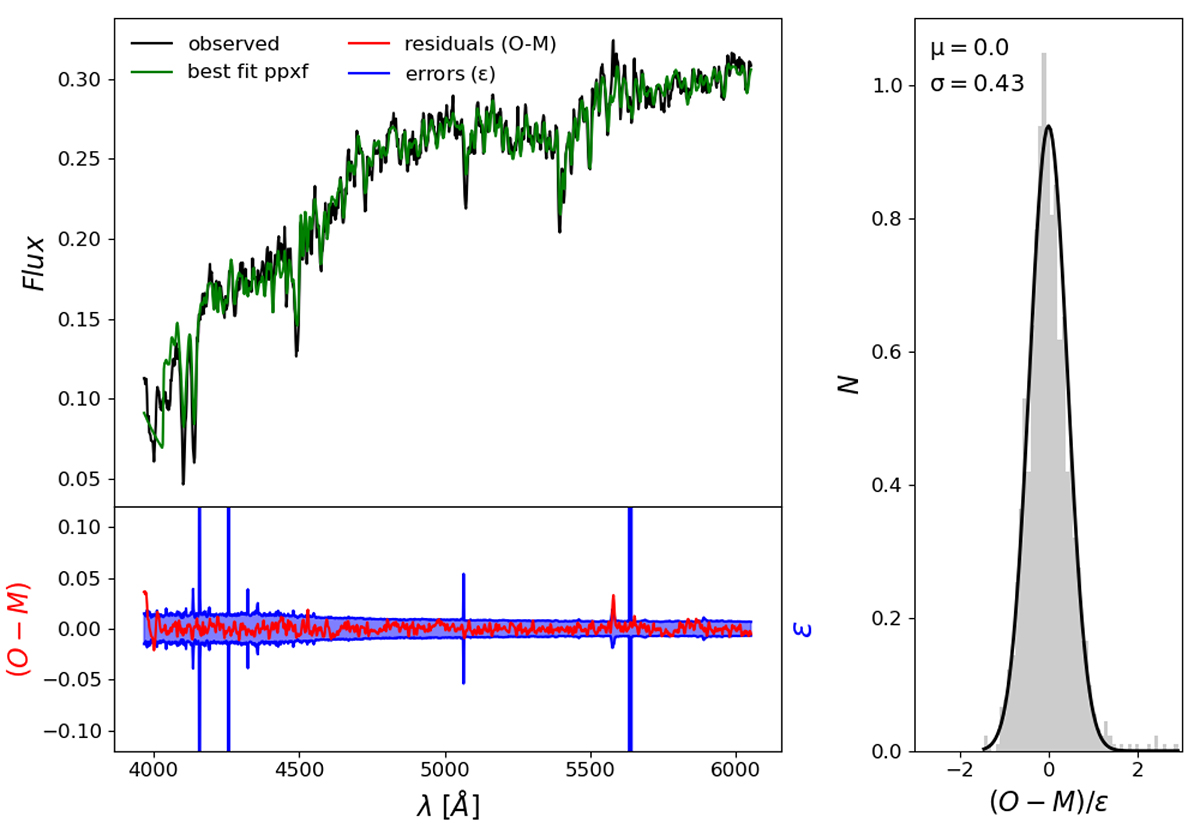
Example of full spectral fitting applied to the central Voronoi bin of CAVITY 40288. In the top-left panel, we overplot to the observed spectrum (black) and the best fit from pPXF (green). The residuals of the fit (red) are compared to the propagated errors for the corresponding spectrum (blue) in the bottom-left panel. The right-hand panel shows a histogram of the ratio of the fitting residuals and the propagated errors including a Gaussian fit for this particular galaxy.
Current usage metrics show cumulative count of Article Views (full-text article views including HTML views, PDF and ePub downloads, according to the available data) and Abstracts Views on Vision4Press platform.
Data correspond to usage on the plateform after 2015. The current usage metrics is available 48-96 hours after online publication and is updated daily on week days.
Initial download of the metrics may take a while.