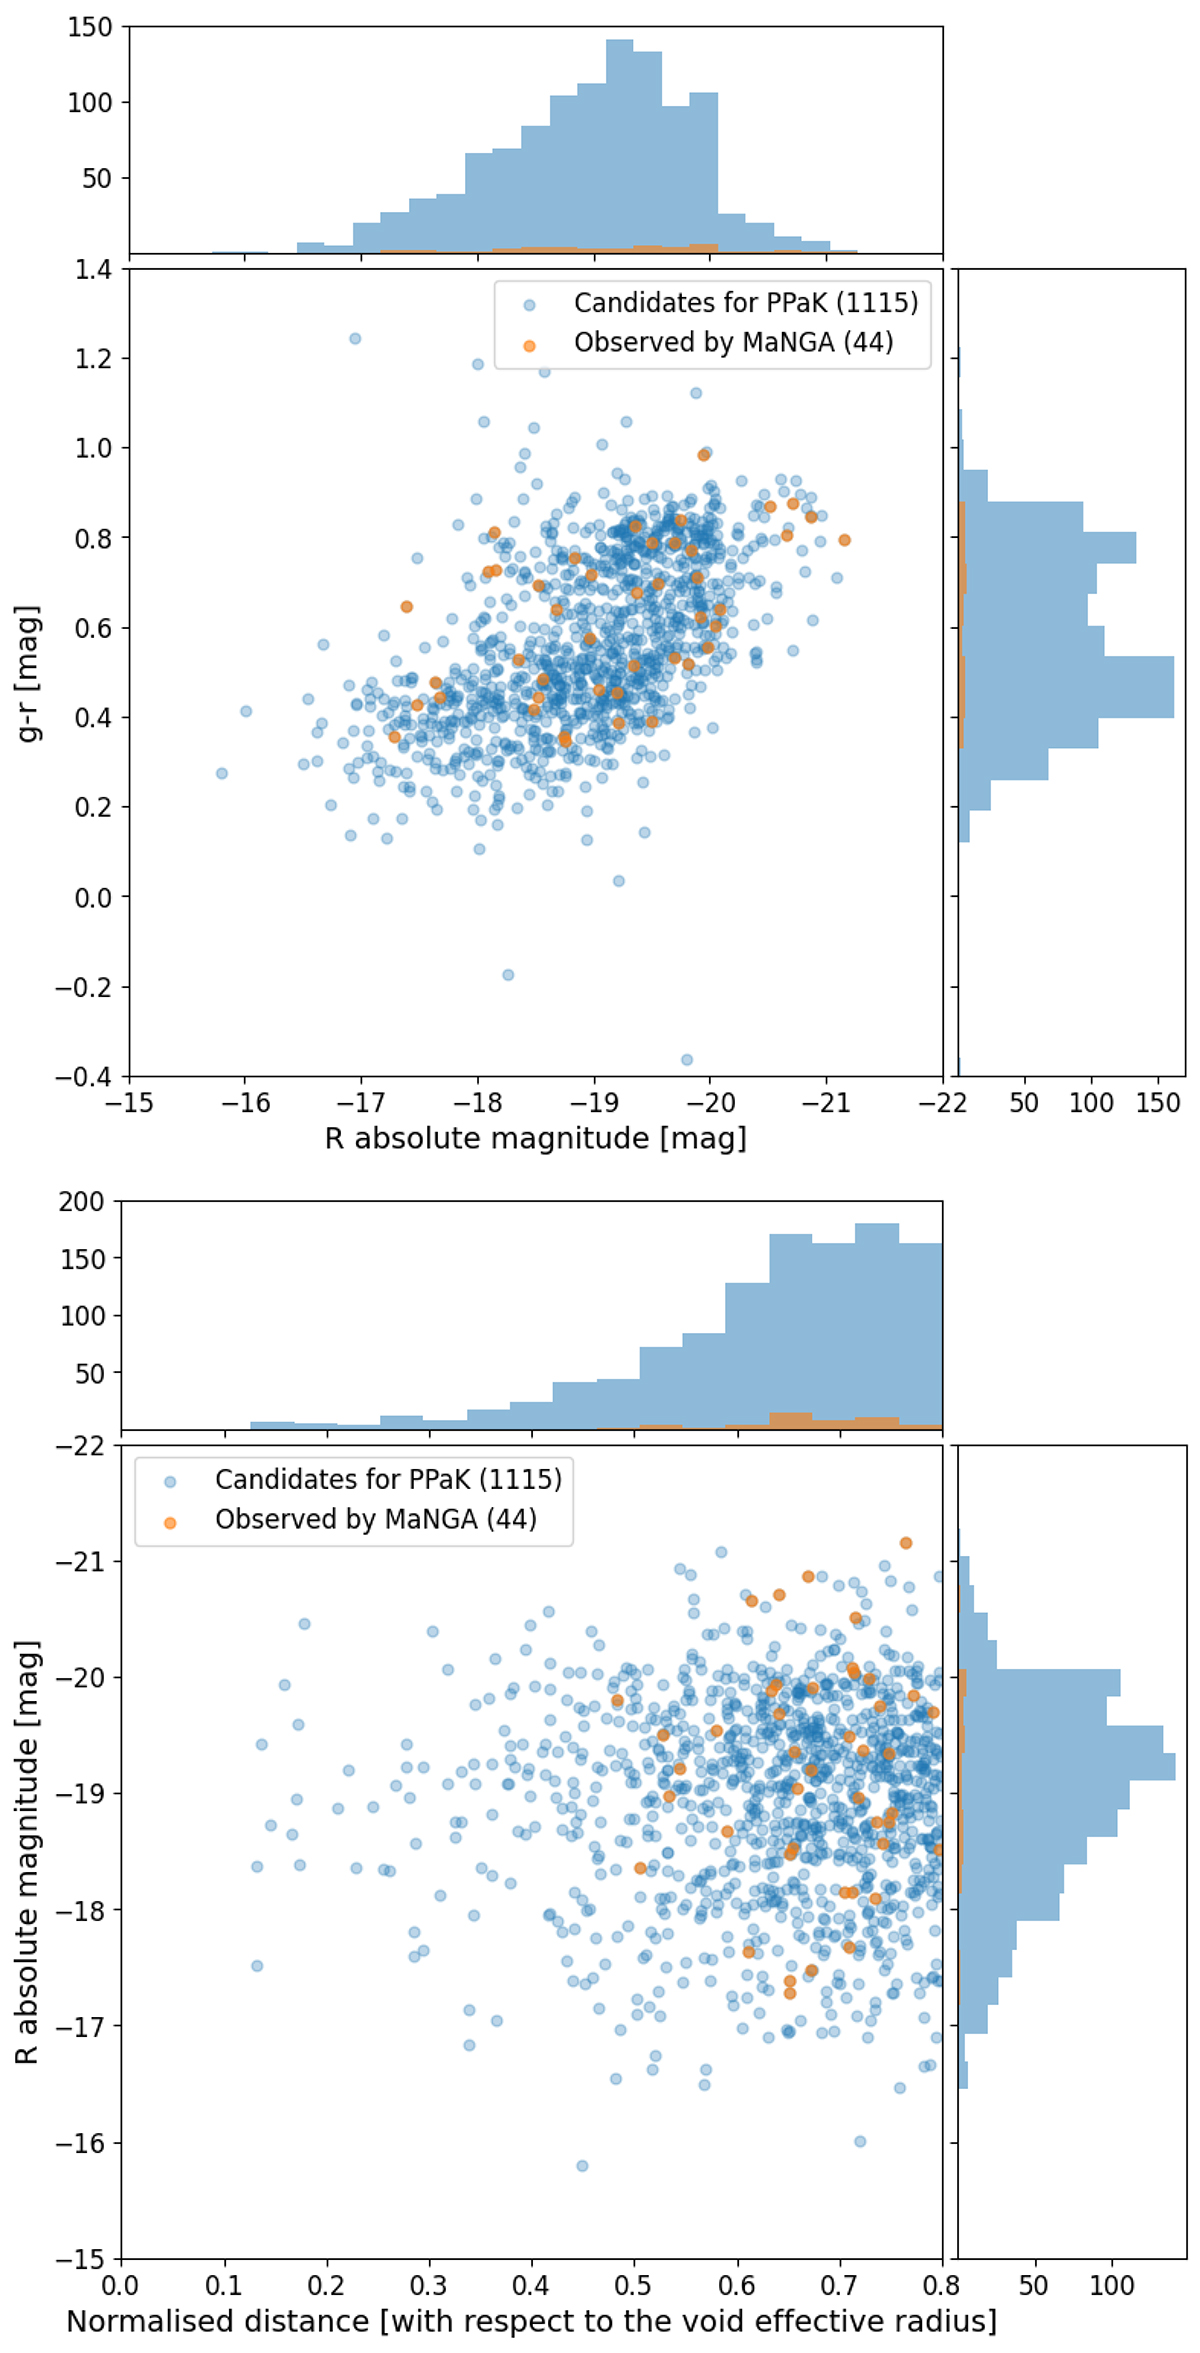
Fig. 2.
Download original image
CAVITY sample characterisation. Top panel: Colour-magnitude diagram of the CAVITY 1115 observable galaxies. Bottom panel: Distribution of the projected distance of the 1115 observable galaxies to the centre of the void normalised to the Reff of the void with respect to the R-band absolute magnitude. In both panels the 44 MaNGA galaxies included in the parent sample have been indicated in orange.
Current usage metrics show cumulative count of Article Views (full-text article views including HTML views, PDF and ePub downloads, according to the available data) and Abstracts Views on Vision4Press platform.
Data correspond to usage on the plateform after 2015. The current usage metrics is available 48-96 hours after online publication and is updated daily on week days.
Initial download of the metrics may take a while.