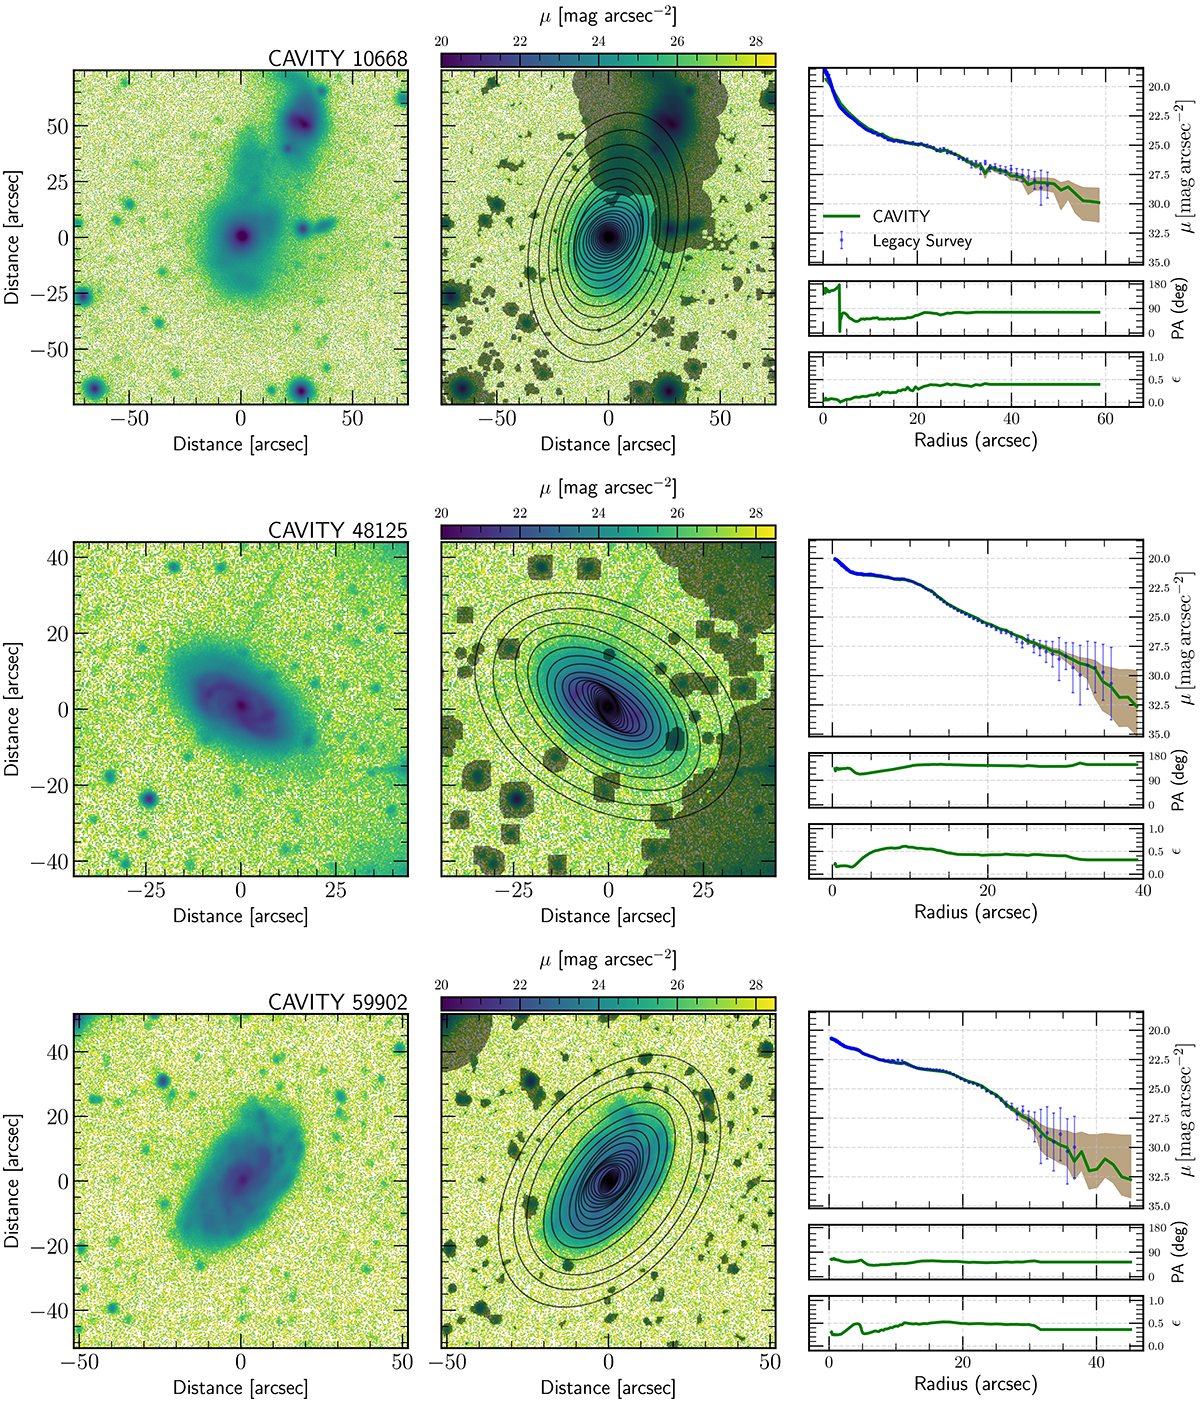
Fig. A.3.
Download original image
Analysis of the light distribution from the INT deep imaging campaigns for the three galaxies included in this paper with INT data so far (CAVITY10668, CAVITY48125, and CAVITY59902, from top to bottom). The left panels show the g-band images from the INT campaign. Middle panels display, on top of the INT images, the masking scheme as well as the isophotal ellipses with varying ellipticity and position angle. The right panels show profiles of SB, position angle (PA), and ellipticity (ϵ) for the three galaxies under analysis. The green lines correspond to the profiles from the INT images. The blue dots are from DECALS using the same procedure as for the INT images (see text for details).
Current usage metrics show cumulative count of Article Views (full-text article views including HTML views, PDF and ePub downloads, according to the available data) and Abstracts Views on Vision4Press platform.
Data correspond to usage on the plateform after 2015. The current usage metrics is available 48-96 hours after online publication and is updated daily on week days.
Initial download of the metrics may take a while.