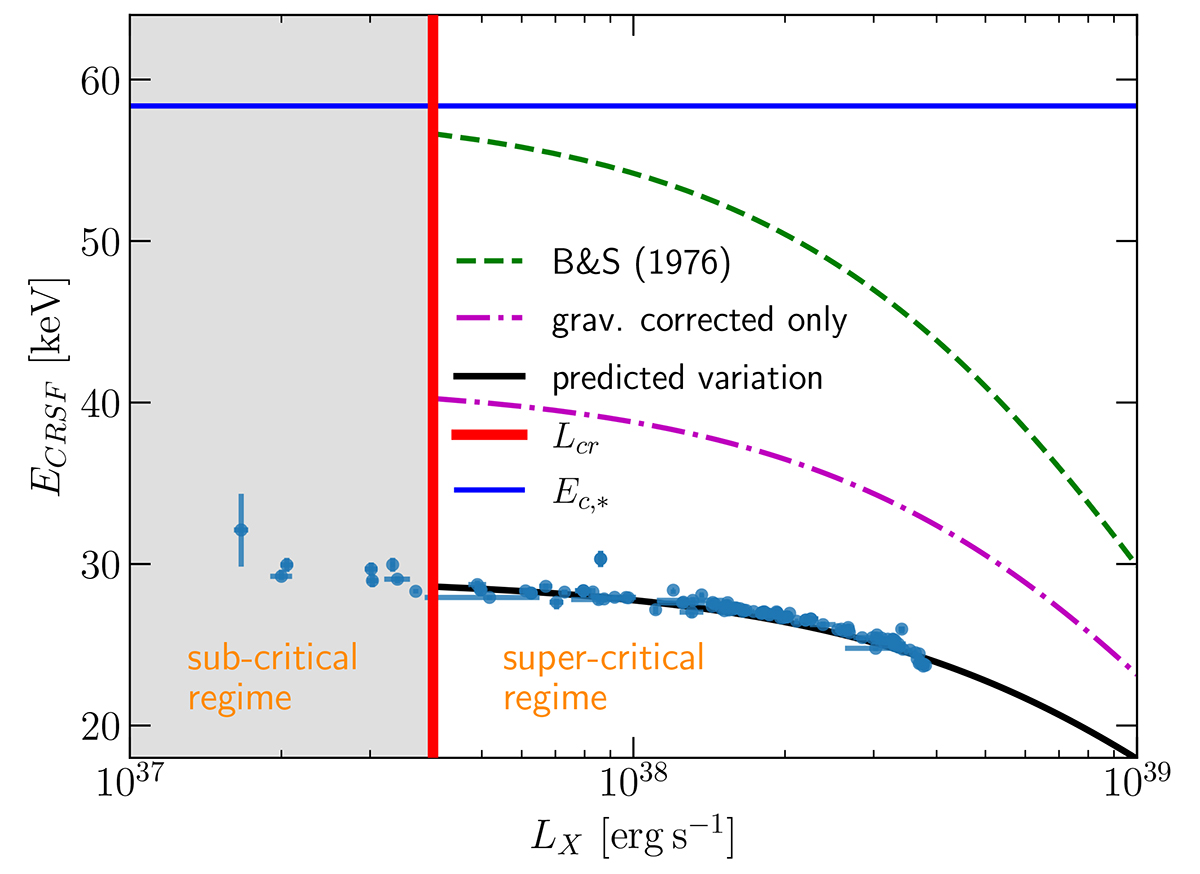
Fig. 2.

Download original image
Observed cyclotron-line energy variation of the source V0332+53 with luminosity. The blue points correspond to data reported in Tsygankov et al. (2010). The solid black line is the optimal fit to the data, using our theoretical prediction. The dashed green line is the expected variation only due to the magnetic-field strength (see Eq. (3) and Basko & Sunyaev 1976), using as Ec, * and a the parameters obtained through the fit. The dash-dotted magenta line is the one accounting for the magnetic field variation and gravitational redshift, but not the Doppler effect (see Sect. 2.2.1). The vertical red line denotes the critical luminosity, and the horizontal blue line represents the cyclotron line energy on the NS’s surface.
Current usage metrics show cumulative count of Article Views (full-text article views including HTML views, PDF and ePub downloads, according to the available data) and Abstracts Views on Vision4Press platform.
Data correspond to usage on the plateform after 2015. The current usage metrics is available 48-96 hours after online publication and is updated daily on week days.
Initial download of the metrics may take a while.


