Open Access
Fig. 9.
Download original image
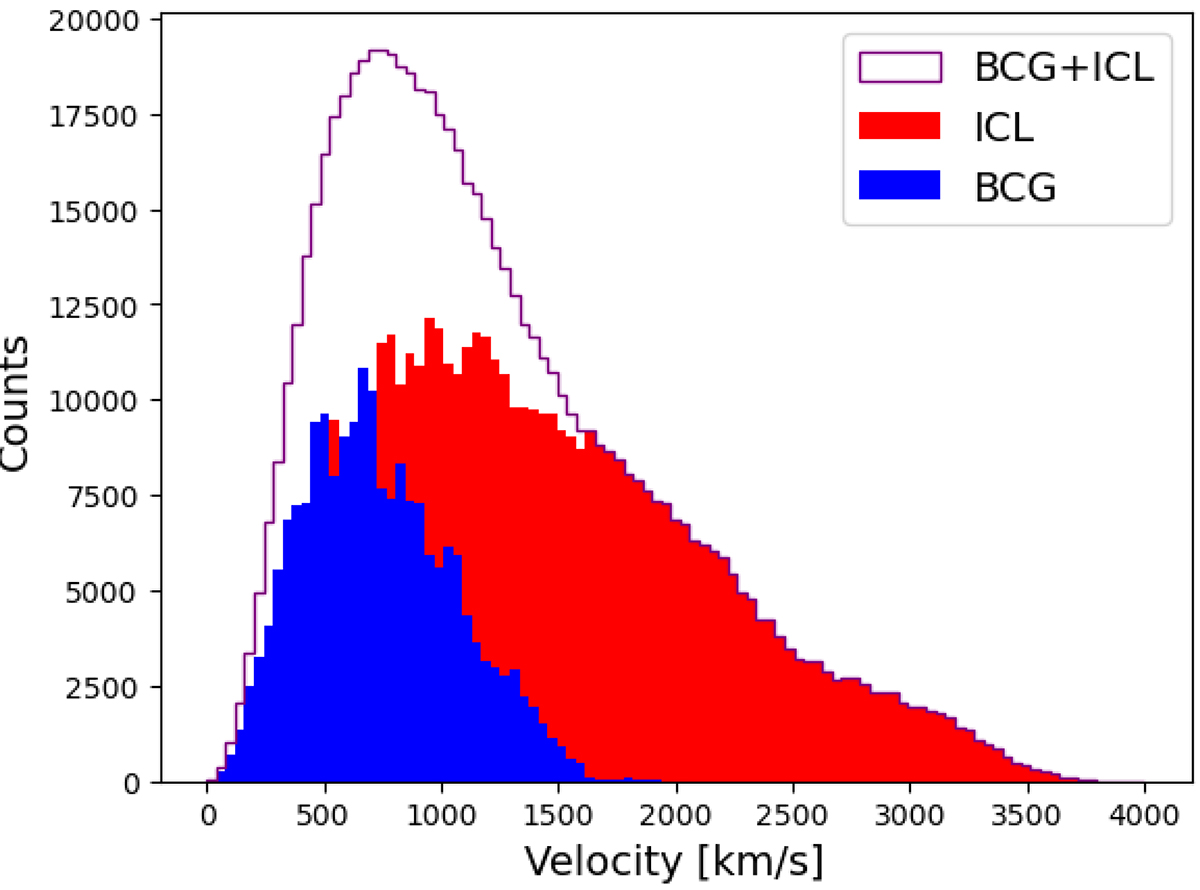
Distribution of the module of the three-dimensional velocity of the stars in the main halo selected among the IllustrisTNG sample. We plot the histograms for BCG (blue) and ICL (red) separately and combined (purple).
Current usage metrics show cumulative count of Article Views (full-text article views including HTML views, PDF and ePub downloads, according to the available data) and Abstracts Views on Vision4Press platform.
Data correspond to usage on the plateform after 2015. The current usage metrics is available 48-96 hours after online publication and is updated daily on week days.
Initial download of the metrics may take a while.