Open Access
Fig. 7.
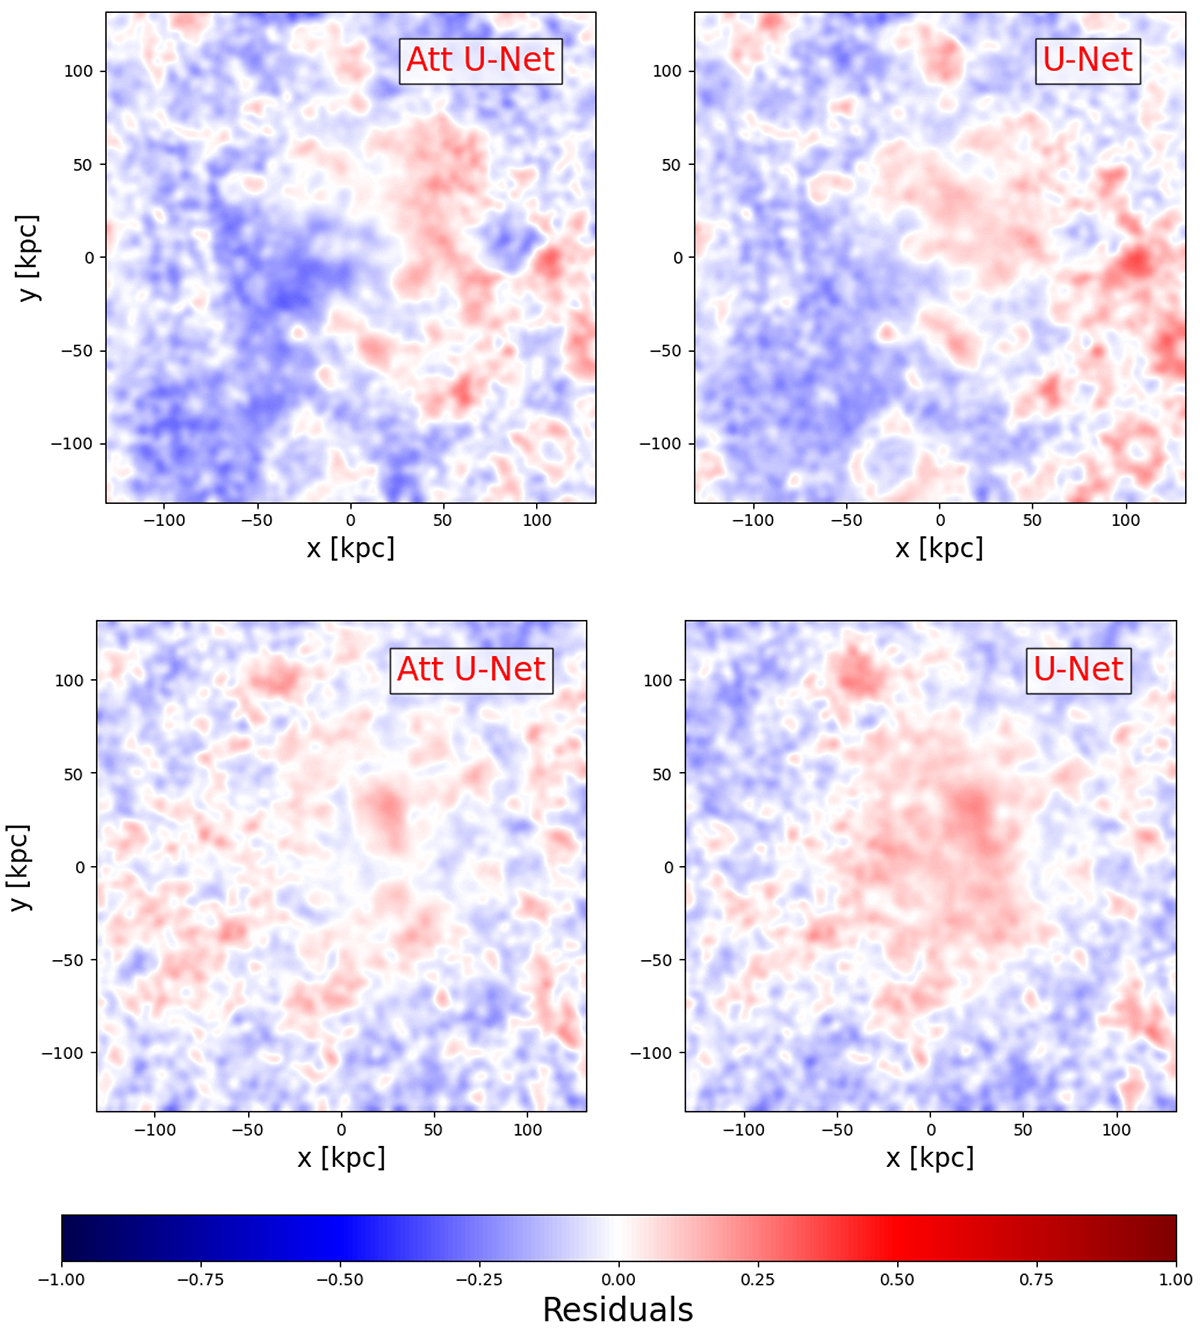
Download original image
Residual heatmaps between the predicted and true ICL distribution for both models. The distribution is smoothed within 4 kpc. The corresponding ICL map distributions are plotted in Fig. 4.
Current usage metrics show cumulative count of Article Views (full-text article views including HTML views, PDF and ePub downloads, according to the available data) and Abstracts Views on Vision4Press platform.
Data correspond to usage on the plateform after 2015. The current usage metrics is available 48-96 hours after online publication and is updated daily on week days.
Initial download of the metrics may take a while.