Open Access
Fig. 2.
Download original image
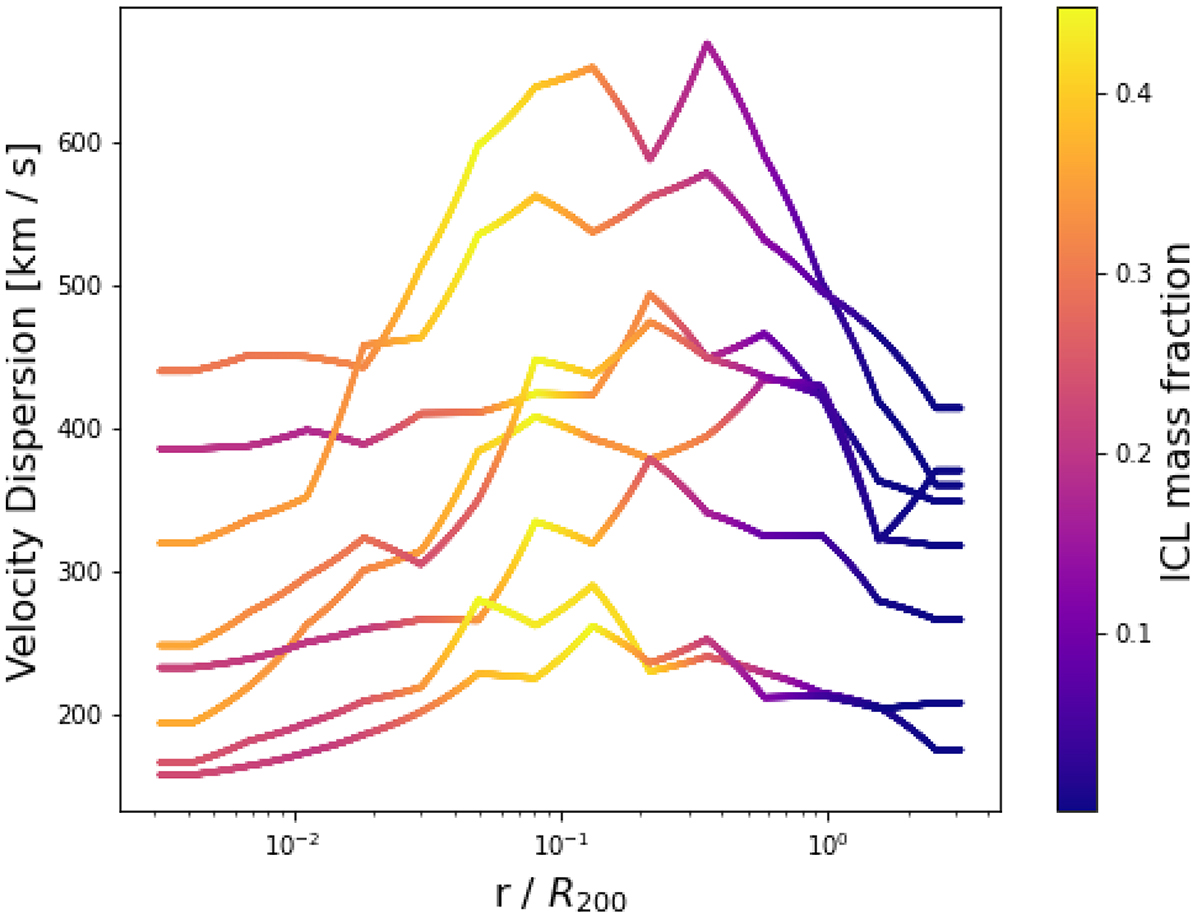
Velocity dispersion profiles of the most massive halos in each of the eight Lagrangian regions. The profiles are displayed as a function of the radial distance from the centre normalised for R200 of the halo. The profiles are colour-coded according to the mean ICL mass fraction within the spherical annuli.
Current usage metrics show cumulative count of Article Views (full-text article views including HTML views, PDF and ePub downloads, according to the available data) and Abstracts Views on Vision4Press platform.
Data correspond to usage on the plateform after 2015. The current usage metrics is available 48-96 hours after online publication and is updated daily on week days.
Initial download of the metrics may take a while.