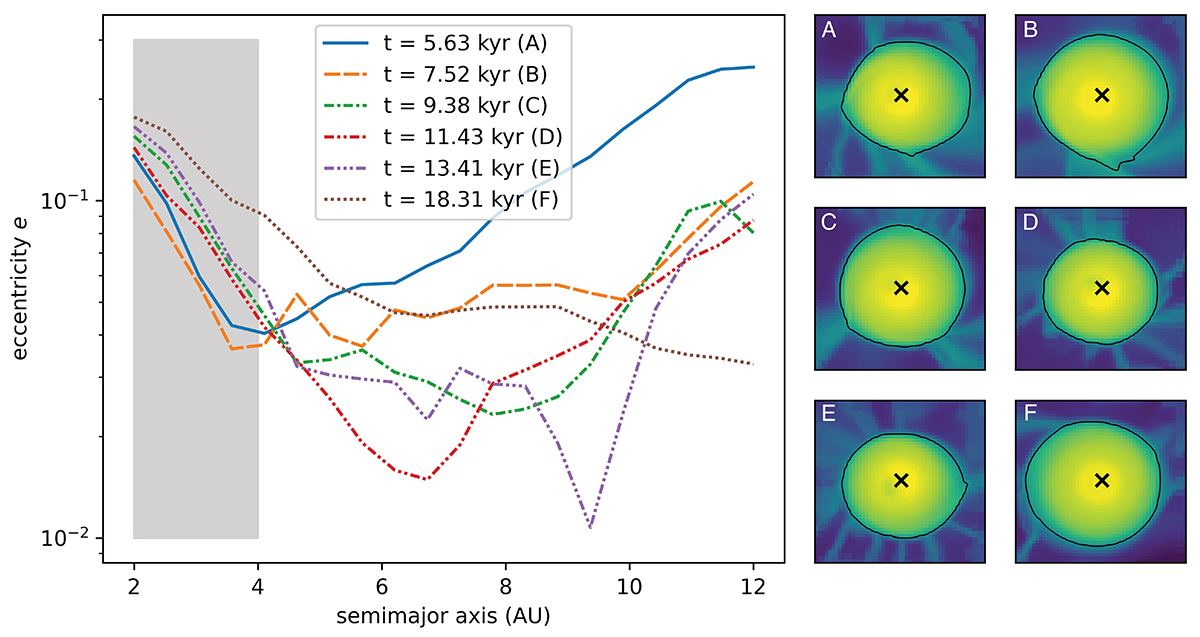
Fig. 4.
Download original image
Plot of disc eccentricity over time in fiducial simulation. The left panel shows eccentricity profiles, the greyed out area falls within the sink radius and should be taken with caution. Right panels show the density maps of the disc (face on view) at each time where the eccentricity was calculated (from left to right and then top to bottom chronologically). On these panels, the cross marks the sink position (not to scale) and the fine black line marks the disc cut isosurface. The outer disc eccentricity decays with time and appears to evolve towards a stable eccentric disc mode.
Current usage metrics show cumulative count of Article Views (full-text article views including HTML views, PDF and ePub downloads, according to the available data) and Abstracts Views on Vision4Press platform.
Data correspond to usage on the plateform after 2015. The current usage metrics is available 48-96 hours after online publication and is updated daily on week days.
Initial download of the metrics may take a while.