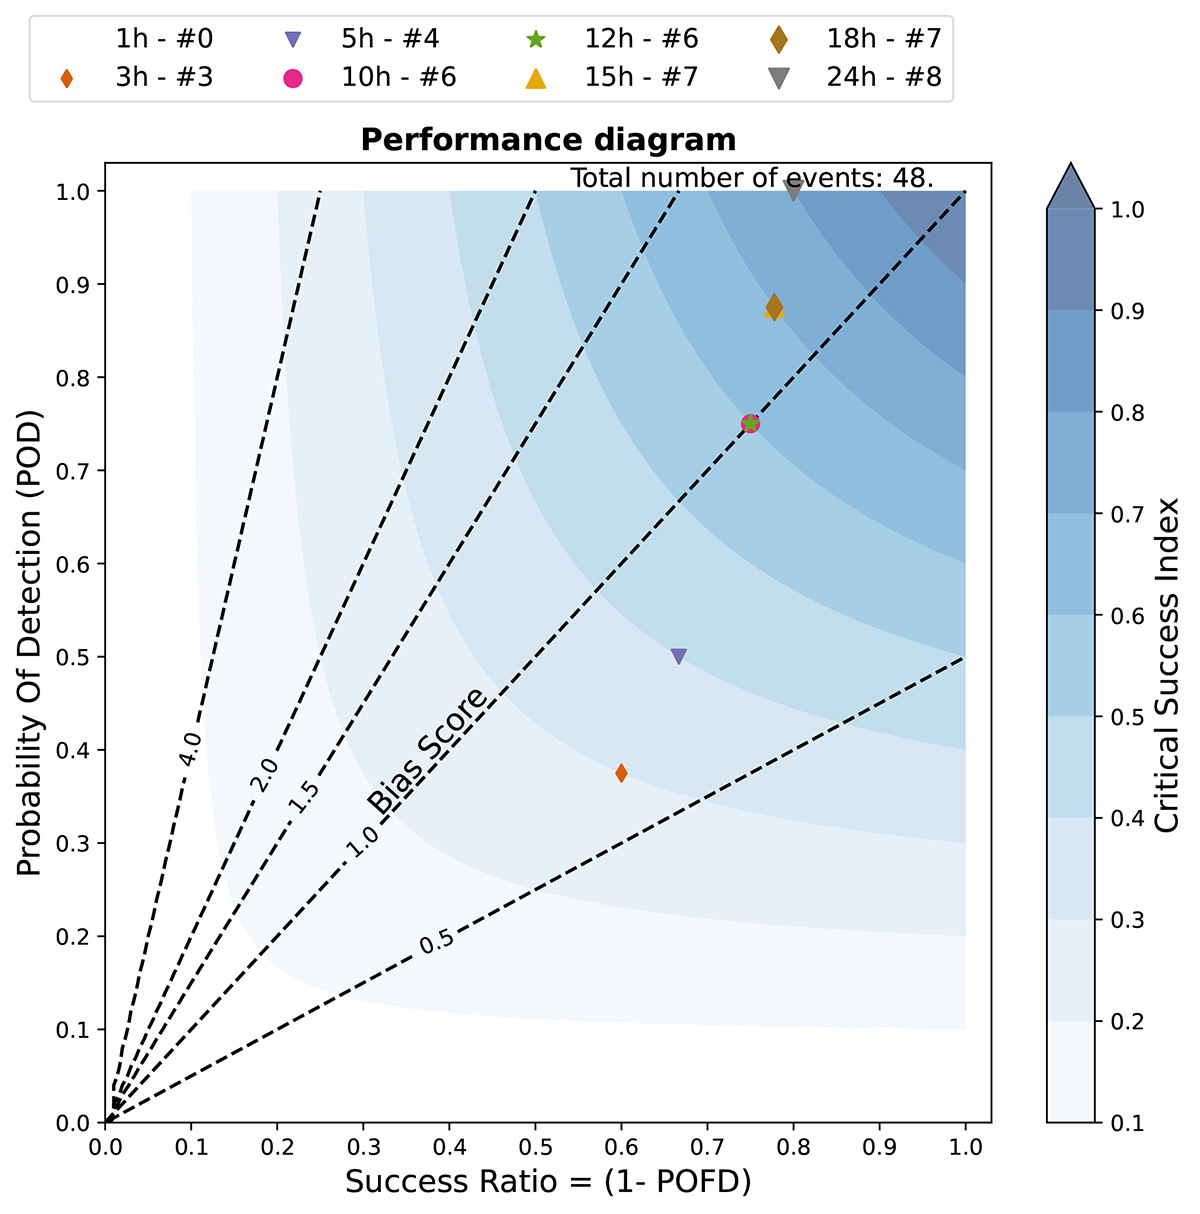
Fig. 9.
Download original image
Performance diagram for the events in Section 2.1.2. The dashed diagonal lines correspond to lines of equal BS, while the blue contours correspond to equal CSI. The coloured dots are used to mark different time intervals allowed for the ICME to arrive. The shortest interval is 1 hour (no ICME arrivals) and the largest one is 24 hours (for which all the ICMEs arrive).
Current usage metrics show cumulative count of Article Views (full-text article views including HTML views, PDF and ePub downloads, according to the available data) and Abstracts Views on Vision4Press platform.
Data correspond to usage on the plateform after 2015. The current usage metrics is available 48-96 hours after online publication and is updated daily on week days.
Initial download of the metrics may take a while.