Fig. 2.
Download original image
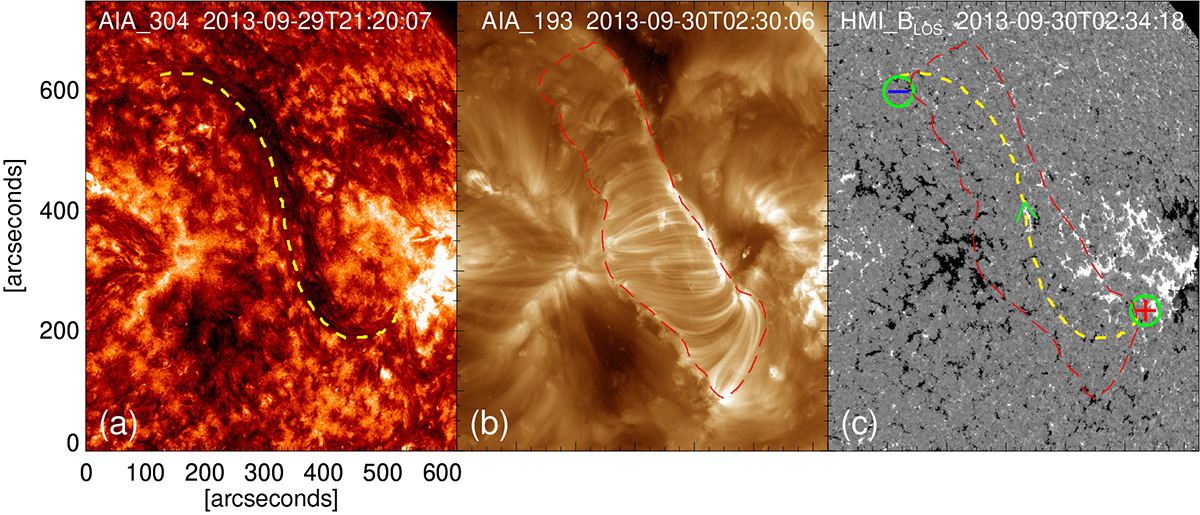
Multi-wavelength observations of the source region of Event no. 12. Panel a Depicts the filament channel as indicated by the yellow dashed line in AIA (Lemen et al. 2012) 304 Å image. The red dashed boundary line in panel b marks the PEA as observed in AIA 193 Å image. Panel c Illustrates the line-of-sight component of the HMI (Scherrer et al. 2012) magnetic field. The red dashed boundary and the yellow dashed line in (c) are the over-plotted PEA region and filament channel, respectively. The two ends of the reverse S-shaped filament channel are marked by the green circles and the underlying magnetic polarities are shown, which indicate a northward-pointing left-handed flux-rope.
Current usage metrics show cumulative count of Article Views (full-text article views including HTML views, PDF and ePub downloads, according to the available data) and Abstracts Views on Vision4Press platform.
Data correspond to usage on the plateform after 2015. The current usage metrics is available 48-96 hours after online publication and is updated daily on week days.
Initial download of the metrics may take a while.