Open Access
Fig. 1.
Download original image
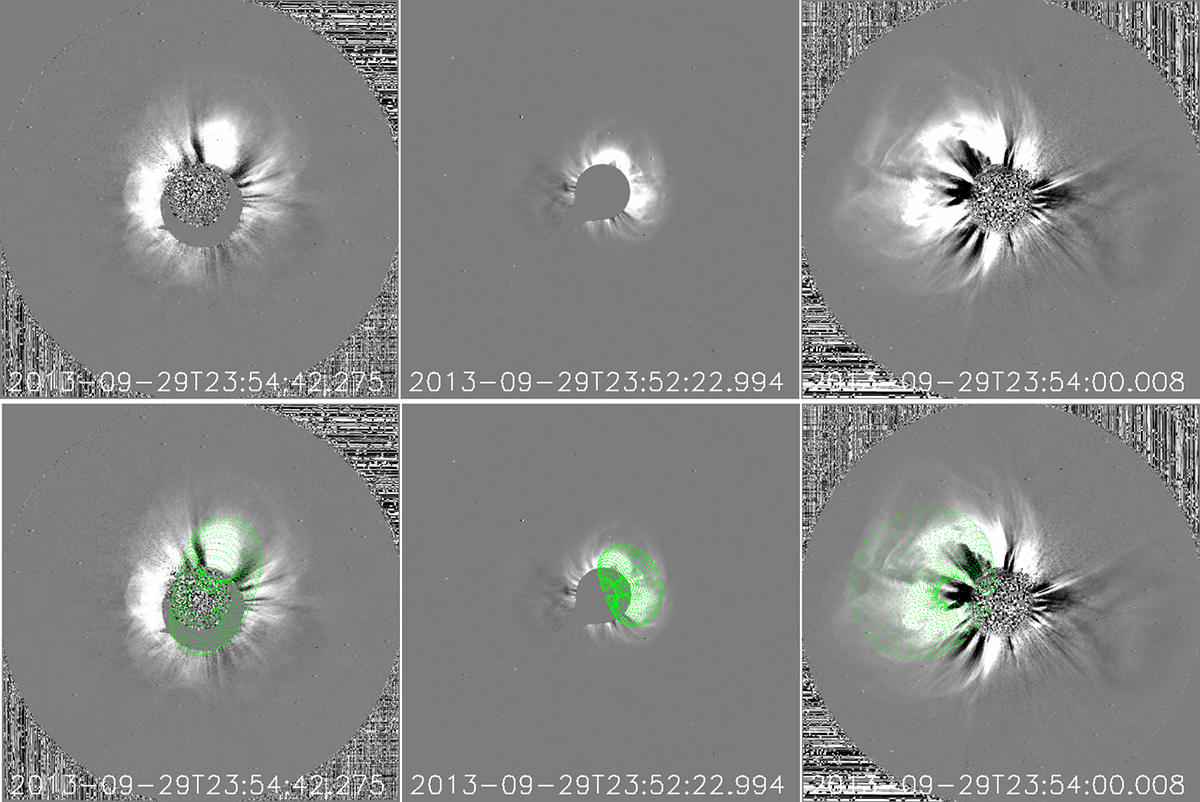
GCS reconstruction of the CME observed at 23:54 UT on 29 September 2013. The fit can be seen in the bottom row. The images shown are from COR2-B (left panel), LASCO-C3 (middle panel), and COR2-A (right panel).
Current usage metrics show cumulative count of Article Views (full-text article views including HTML views, PDF and ePub downloads, according to the available data) and Abstracts Views on Vision4Press platform.
Data correspond to usage on the plateform after 2015. The current usage metrics is available 48-96 hours after online publication and is updated daily on week days.
Initial download of the metrics may take a while.