Fig. 9.
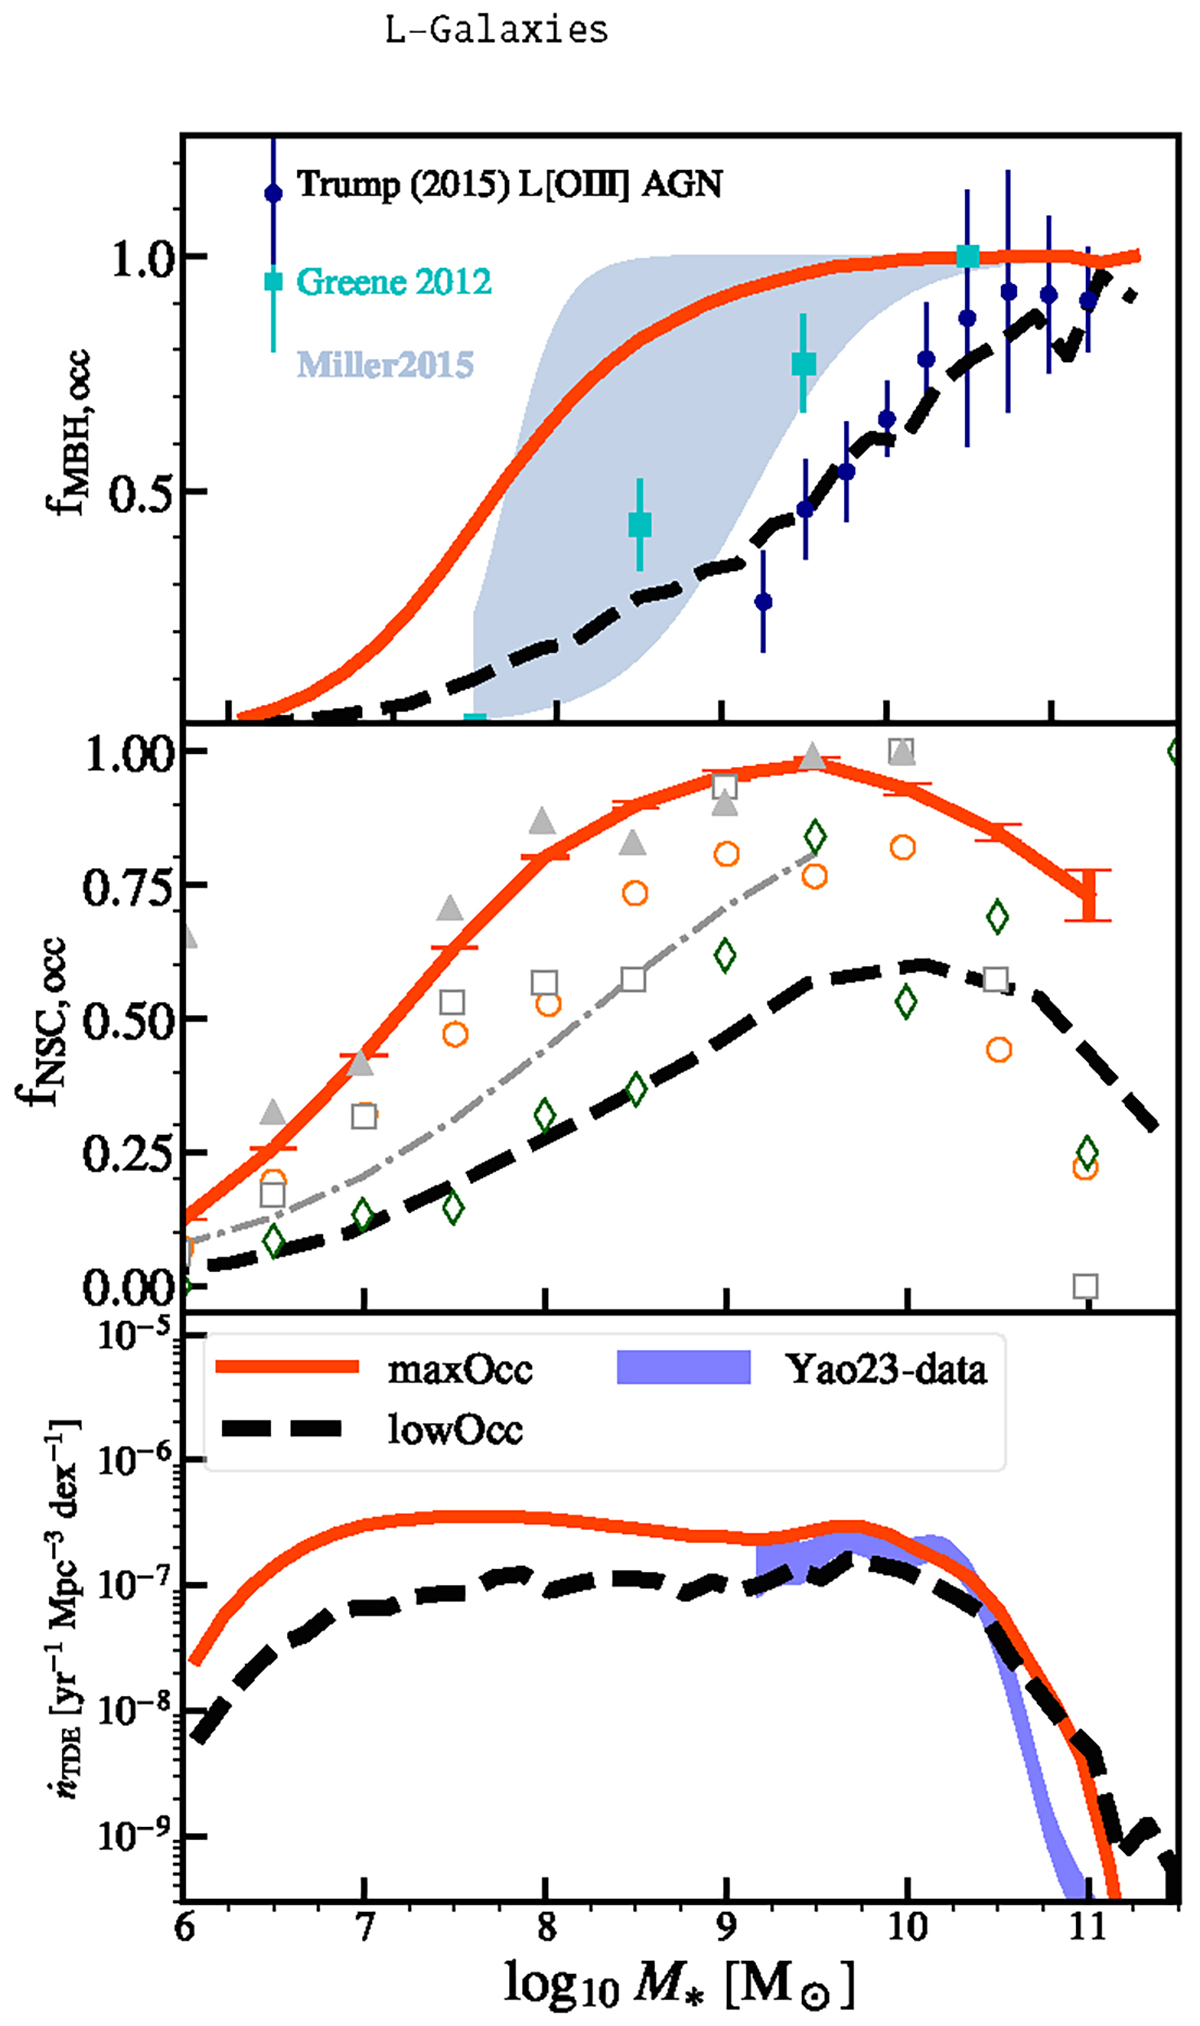
Download original image
Variations of the seeding probability in L-Galaxies BH. Top and middle panels: occupation fractions of MBH (M• > 105 M⊙, top) and NSC (all masses, middle) that result into the volumetric TDE rates as a function of galaxy-host mass (bottom). We show the maxOcc and lowOcc models with orange solid and black dashed lines, respectively. In the top panels we display the local MBH occupation fraction derived from a compilation of detections 2012 (2012, cyan squares) and X-ray constraints by Miller & Davies (2012, light-blue region), as well as an occupation for slightly higher redshifts 0.01 < z < 0.1 derived via optical-line AGN Trump et al. (2015, blue circles). In the middle panel, the data points and logistic function (the dashed-dotted thin line), both from Hoyer et al. (2021), have the same meaning as in Fig. 2. The enhanced MBH occupation is still compatible with the observations of the Coma Cluster (gray triangles), even though it yields a greater fraction of nucleated galaxies. We stress that all NSCs are hosting an MBH in our model, hence adding NSCs without MBHs would increase this fraction. Bottom panel: Both maxOcc and lowOcc model (solid and dashed line) reproduce the TDE-rate distribution constraint of Yao et al. (2023) within errors. However, in the lack of evidence of TDEs in dwarf galaxies the lowOcc model is preferred.
Current usage metrics show cumulative count of Article Views (full-text article views including HTML views, PDF and ePub downloads, according to the available data) and Abstracts Views on Vision4Press platform.
Data correspond to usage on the plateform after 2015. The current usage metrics is available 48-96 hours after online publication and is updated daily on week days.
Initial download of the metrics may take a while.