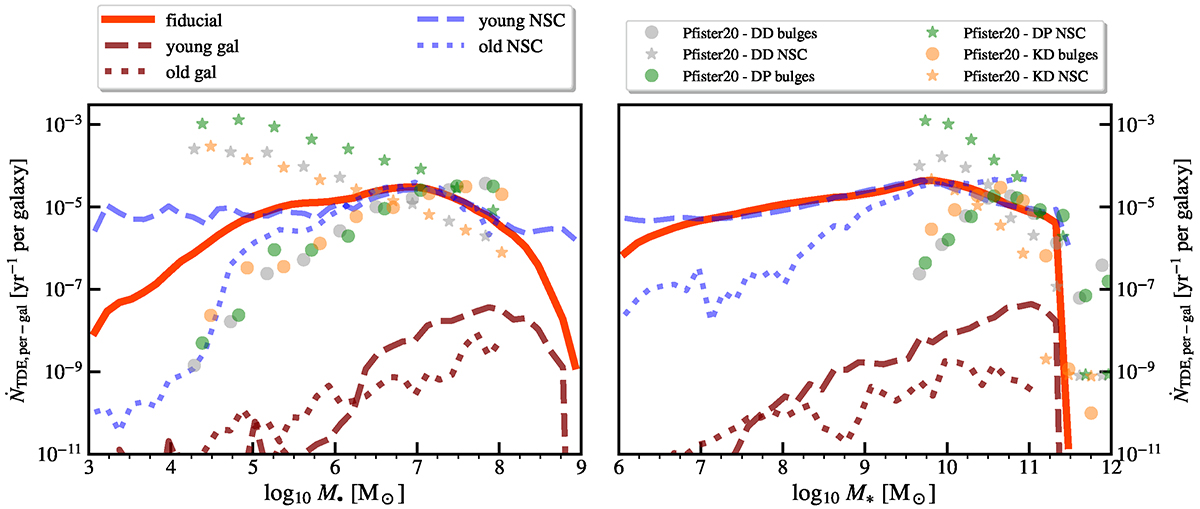
Fig. 6.
Download original image
Average TDE rates per log mass of MBH M• (left) and of the MBH host galaxy M* (right) for the fiducial model at z = 0.0 (solid red line, tagged as “all”). We averaged separately over NSC rates (light-blue lines) and galaxy component rates (maroon lines), and subsequently split into just restarted (“young” systems with ΔtTD < 30 Myr, dashed line) and after a long time (“old” systems with ΔtTD > 3 Gyr, dotted lines). For comparison, we present the results of (Pfister et al. 2020) for three different scaling relation pairs of MBH galaxy stellar mass and NSC mass size adopted in their work (DD, DP, and KD as defined in Table 2 of Pfister et al. 2020) to bracket the uncertainties following these hypotheses.
Current usage metrics show cumulative count of Article Views (full-text article views including HTML views, PDF and ePub downloads, according to the available data) and Abstracts Views on Vision4Press platform.
Data correspond to usage on the plateform after 2015. The current usage metrics is available 48-96 hours after online publication and is updated daily on week days.
Initial download of the metrics may take a while.