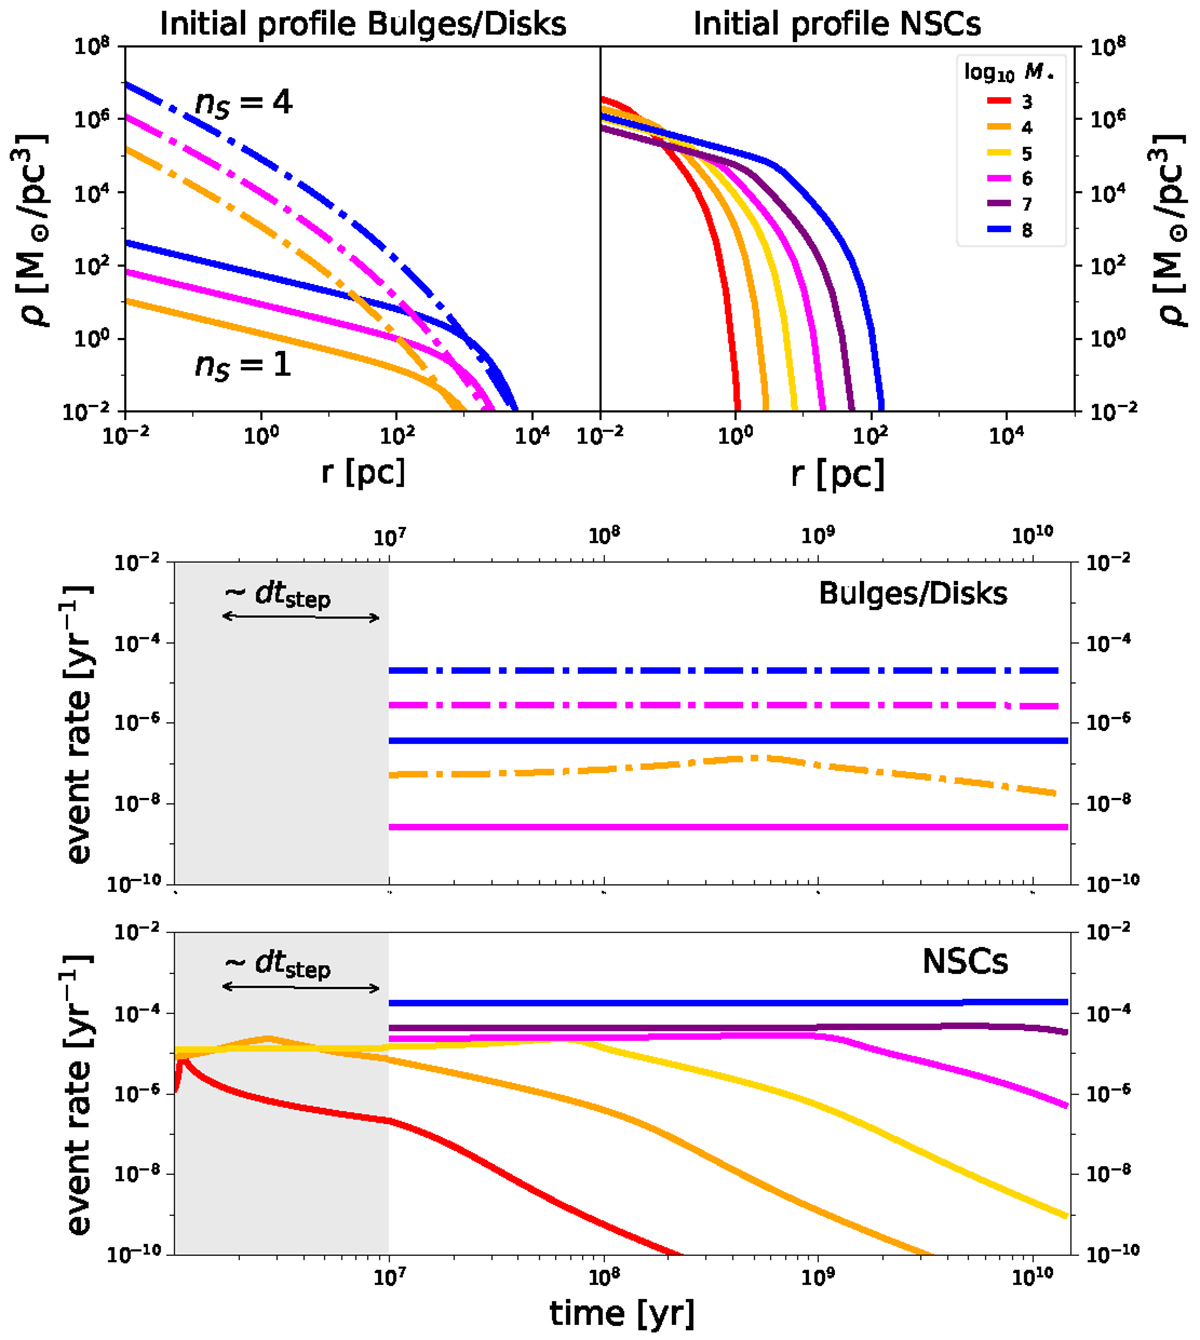
Fig. 3.
Download original image
Density profiles for different MBHs and the resulting time-dependent TDE rates. Top panels: stellar density profiles for a range of MBH masses as indicated in the inset legend (with the same color coding applying to all panels of the figures). Disks have been assigned nS = 1 Sérsic profiles (solid lines, left), while bulges have nS = 4 profiles (dotted lines, left). The NSCs were instead assigned spheroid profiles from Eq. (9) (right). The galaxy and NSC host properties scale with M• as described in the text and are created to be representative of the average environment encountered in L-Galaxies BH. Middle and bottom panels: tidal disruption event rate evolution with PHASEFLOW when initiating for different MBH mass with the associated profiles from the top panels, displayed separately for bulges or disks (galaxy component, middle panel) and NSCs (bottom). The gray region below 10 Myr indicates the region where we trace unresolved growth and high-rates below the time-resolution dtstep for the black holes in NSCs with mass M• < 106 M⊙. This initial phase we refer to as prompt phase.
Current usage metrics show cumulative count of Article Views (full-text article views including HTML views, PDF and ePub downloads, according to the available data) and Abstracts Views on Vision4Press platform.
Data correspond to usage on the plateform after 2015. The current usage metrics is available 48-96 hours after online publication and is updated daily on week days.
Initial download of the metrics may take a while.