Fig. 1.
Download original image
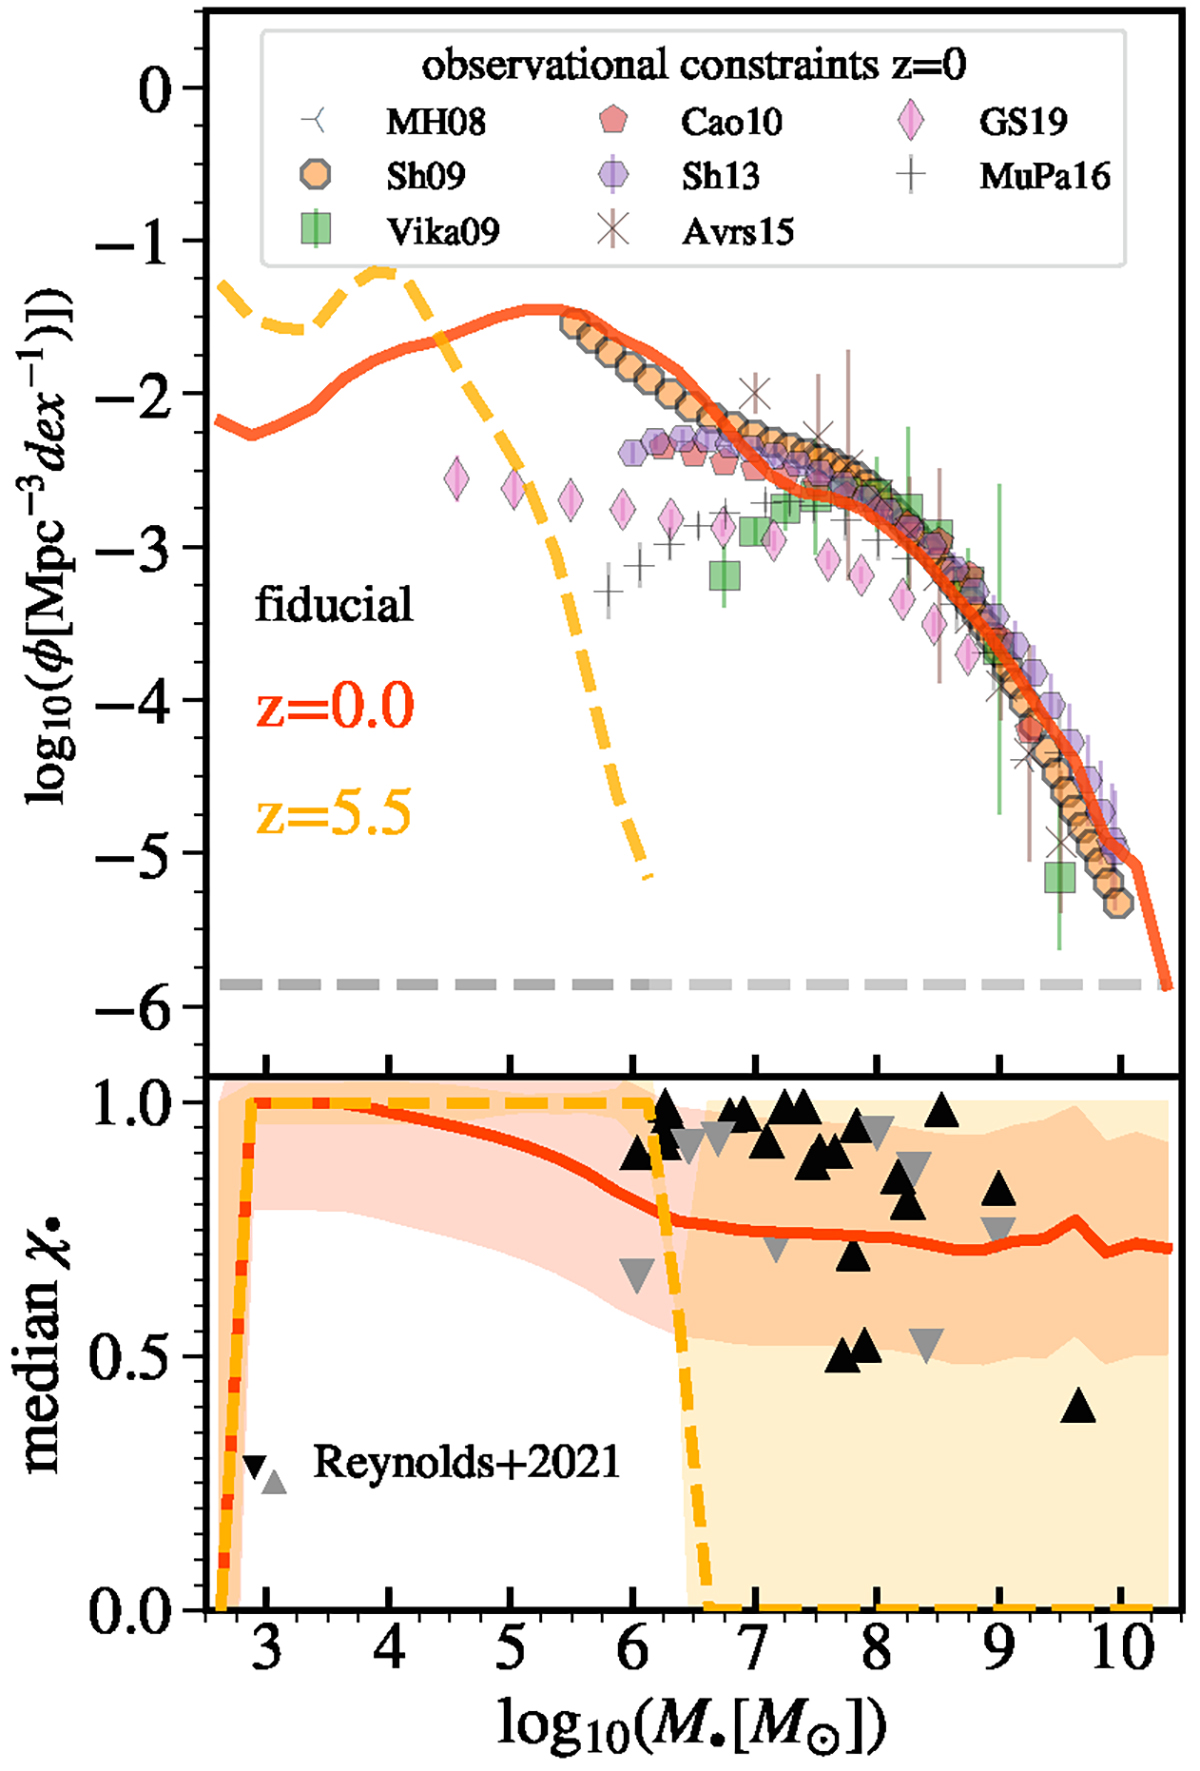
Massive black hole mass function (top) and median spin for X-ray bright MBHs (bottom) as a function of the MBH mass M• predicted by the L-Galaxies BH model used in this work. Data are shown for z = 0 (red solid line) and z = 5.5 (yellow dashed line), with shaded areas in the bottom panel referring to the 1σ dispersion at a given mass range. In the top panel, the gray dashed line corresponds to the MBH mass function value equal to 1 dex−1 per MSII simulation volume. The results are compared with observational data at z = 0; MH08, Vika09, Sh09, Cao10, Sh13, Arvs15, GS19, and MuPa16 refer to the model-dependent constraints on the MBH mass function derived respectively by Merloni & Heinz (2008), Cao (2010), Gallo & Sesana (2019), Shankar et al. (2009, 2013), Mutlu-Pakdil et al. (2016), Vika et al. (2009), Aversa et al. (2015). For spin constraints, we display the upper and lower limits from X-ray reflection spectroscopy (Reynolds 2021). For a closer comparison to observational results, the average spin values shown here are for MBHs with a predicted hard X-ray luminosity of log LHX > 40 erg s−1.
Current usage metrics show cumulative count of Article Views (full-text article views including HTML views, PDF and ePub downloads, according to the available data) and Abstracts Views on Vision4Press platform.
Data correspond to usage on the plateform after 2015. The current usage metrics is available 48-96 hours after online publication and is updated daily on week days.
Initial download of the metrics may take a while.