Fig. 9.
Download original image
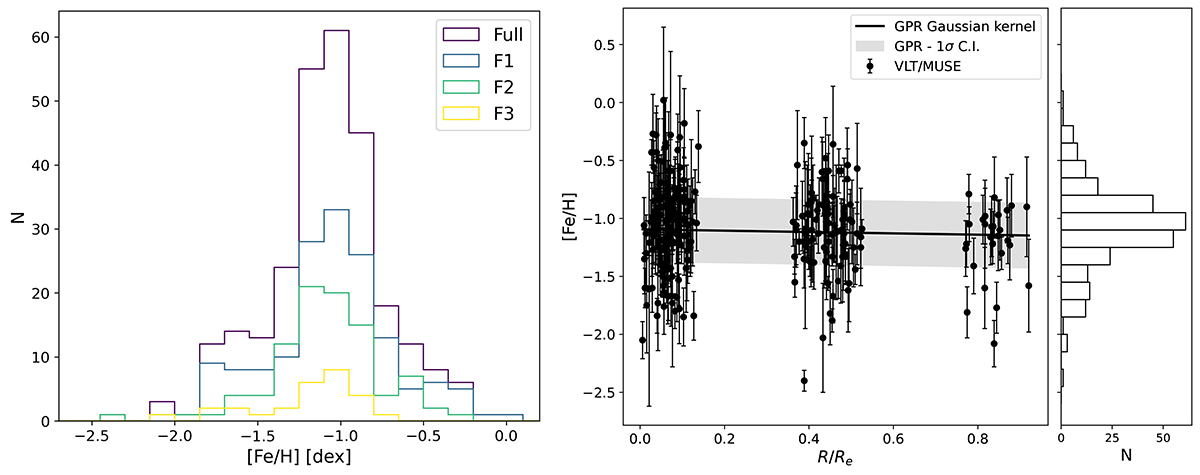
Metallicity distributions. Left: Histograms of the metallicity values for the full sample and for each pointing coloured in purple, blue, green, and yellow, respectively. Right: [Fe/H] values as a function of the elliptical radius scaled with Re, represented as black dots. The black solid line represents the result of a Gaussian process regression analysis using a Gaussian kernel and taking into account an intrinsic scatter; the grey band indicates the corresponding 1σ confidence interval. The histogram on the right side represents the metallicity distribution of the full sample.
Current usage metrics show cumulative count of Article Views (full-text article views including HTML views, PDF and ePub downloads, according to the available data) and Abstracts Views on Vision4Press platform.
Data correspond to usage on the plateform after 2015. The current usage metrics is available 48-96 hours after online publication and is updated daily on week days.
Initial download of the metrics may take a while.