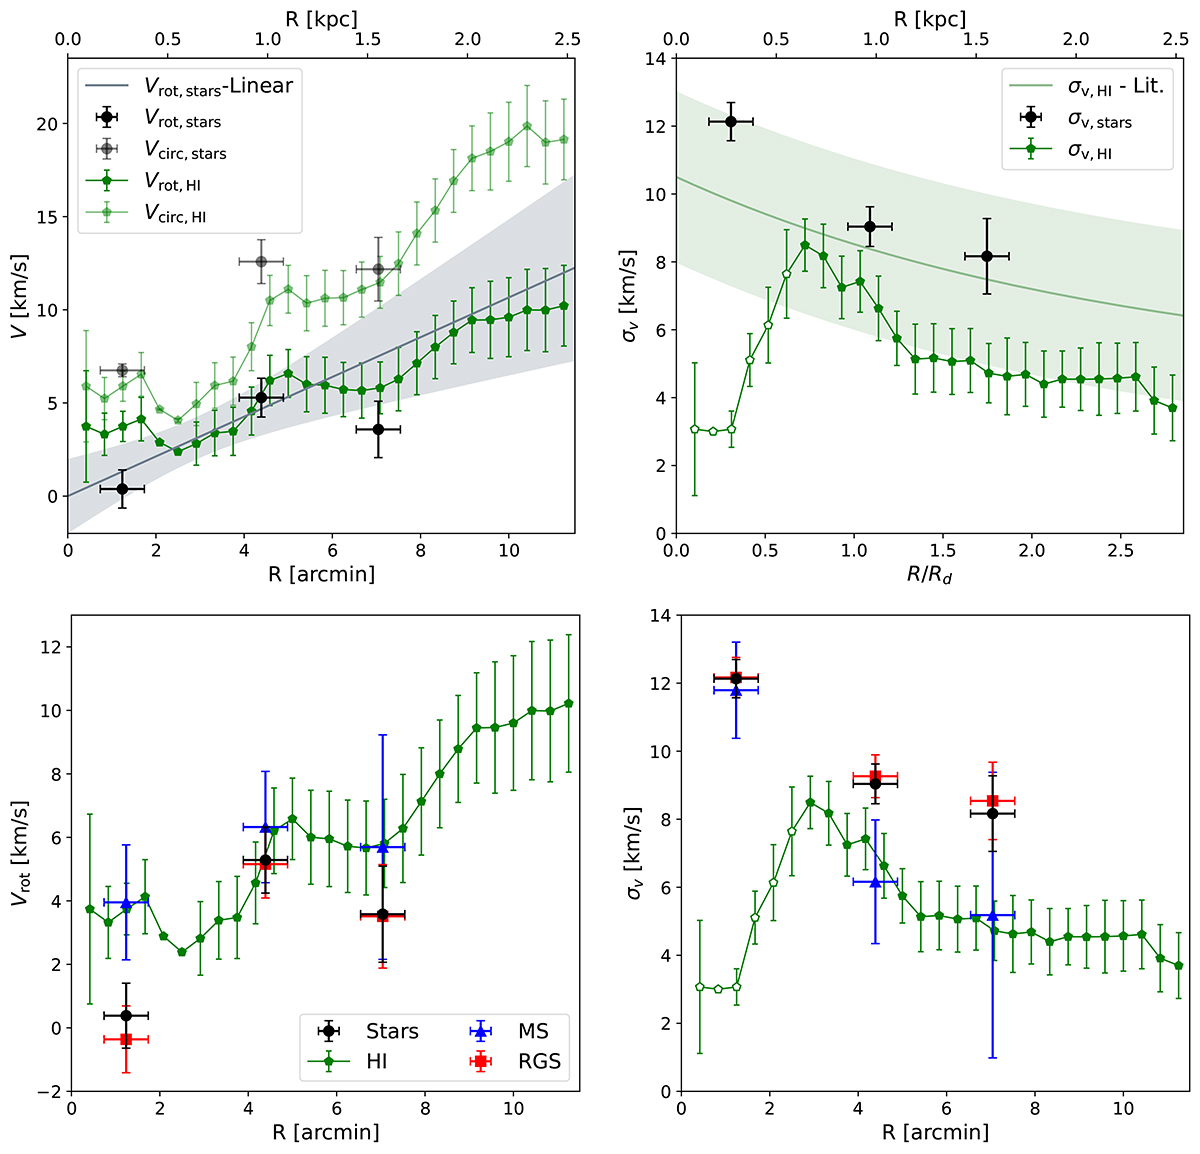
Fig. 8.

Download original image
Average rotational velocity (left) and velocity dispersion (right) values for the full stellar sample (top) and dividing by spectral type (bottom) projected along the HI kinematic semi-major axis. Black circles represent the values obtained for the probable members per pointing, while coloured symbols indicate values obtained from the subsamples of red giant (red squares) and main sequence stars (blue triangles); also shown are the rotational velocity and dispersion values for the HI (green pentagons; Read et al. 2016). The circular velocity values for both stars and the HI are also shown (light black circles and light green pentagons, respectively), correcting for the asymmetric drift and assuming an inclination angle of iHI = 39.4°. The grey line represents the rotation curve from the linear model adopted in Sect. 4, with the grey bands indicating the 95% confidence interval. The lightgreen line is an exponential fit to the dispersion profiles of a set of dwarf galaxies with high-resolution HI data having similar mass as IC 1613 and radii normalised to the scale radius Rd (Iorio et al. 2017; Mancera Piña et al. 2021, 2024); the lightgreen bands indicates a typical uncertainty of 2.5 km s−1. For the stellar component, the error bars in the radial direction indicate that the rotational velocities are averages within the extent of each MUSE pointing.
Current usage metrics show cumulative count of Article Views (full-text article views including HTML views, PDF and ePub downloads, according to the available data) and Abstracts Views on Vision4Press platform.
Data correspond to usage on the plateform after 2015. The current usage metrics is available 48-96 hours after online publication and is updated daily on week days.
Initial download of the metrics may take a while.


