Open Access
Fig. 4.
Download original image
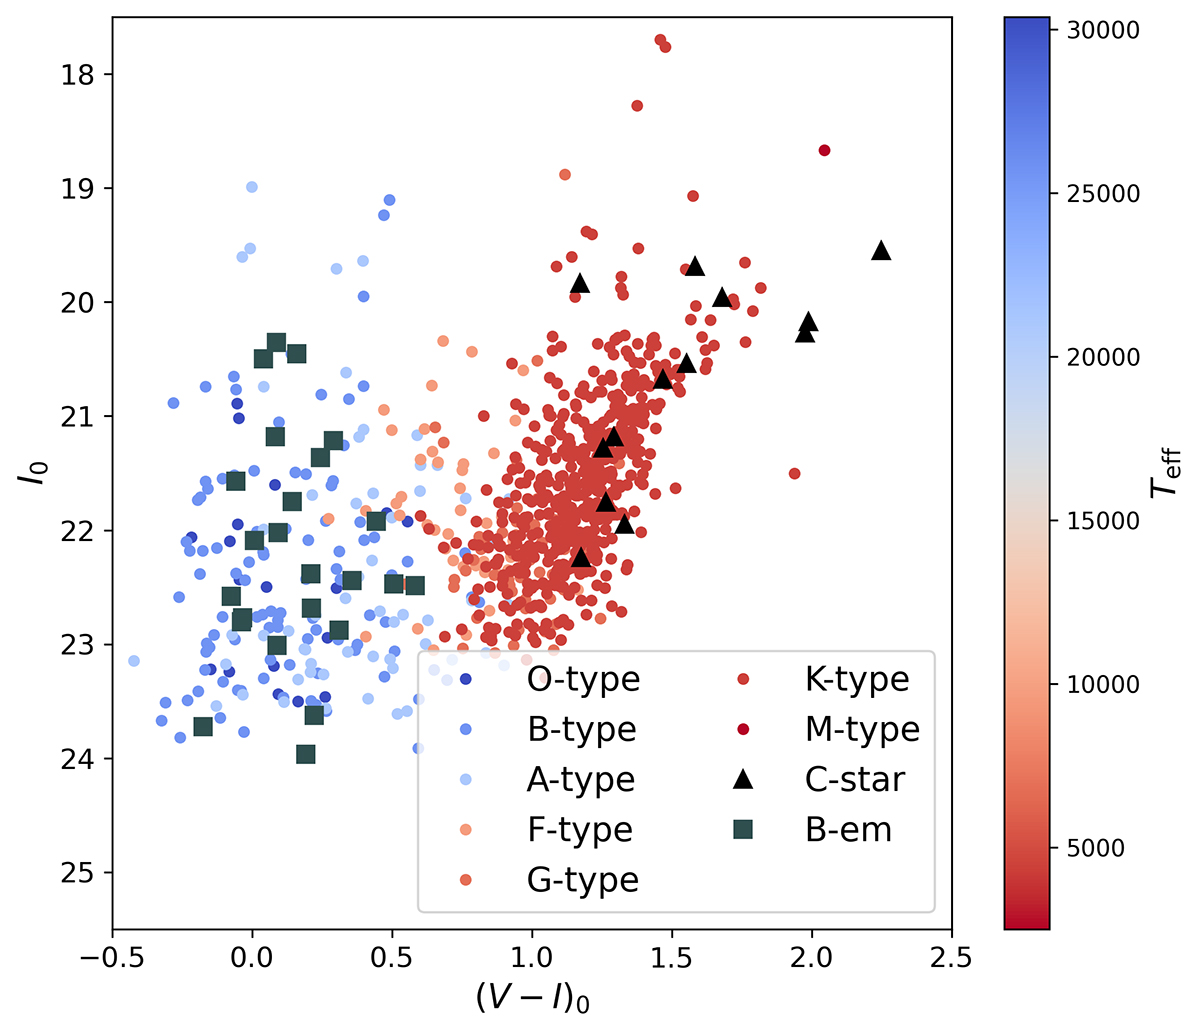
Colour-magnitude diagram for data selected with PCL-flag between 3 and 4, as described in Sect. 3.1.1. Filled circles are colour-coded according to their effective temperature Teff as derived with ULySS; black triangles indicate the identified C-stars, while the grey squares mark the Be stars.
Current usage metrics show cumulative count of Article Views (full-text article views including HTML views, PDF and ePub downloads, according to the available data) and Abstracts Views on Vision4Press platform.
Data correspond to usage on the plateform after 2015. The current usage metrics is available 48-96 hours after online publication and is updated daily on week days.
Initial download of the metrics may take a while.