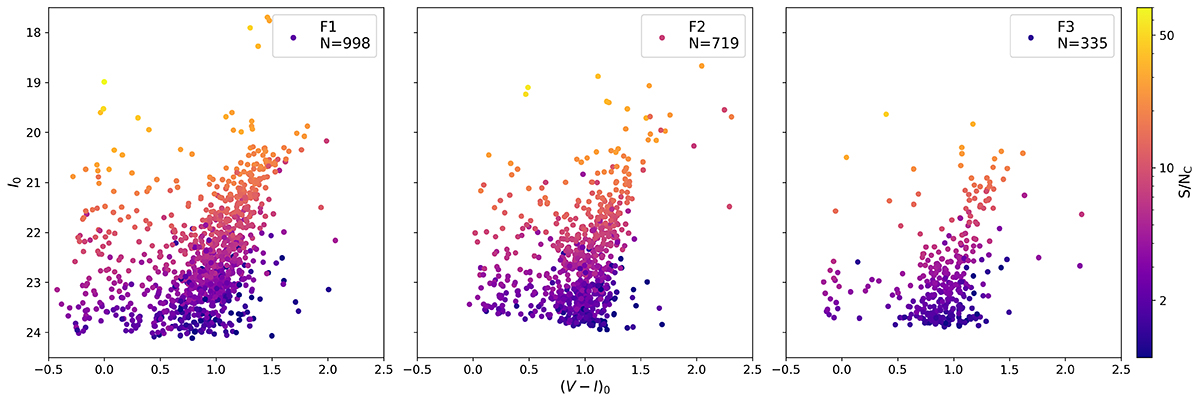
Fig. 3.
Download original image
Extinction-reddening corrected colour-magnitude diagrams from MUSE images of the three fields, moving from the centre towards the outer regions from left to right; the filled circles represent the sources for which spectra have been extracted and they are colour-coded by their S/N at the central wavelength. We note that the galaxy’s distance modulus is (m − M)0 = 24.4 (Bernard et al. 2010).
Current usage metrics show cumulative count of Article Views (full-text article views including HTML views, PDF and ePub downloads, according to the available data) and Abstracts Views on Vision4Press platform.
Data correspond to usage on the plateform after 2015. The current usage metrics is available 48-96 hours after online publication and is updated daily on week days.
Initial download of the metrics may take a while.