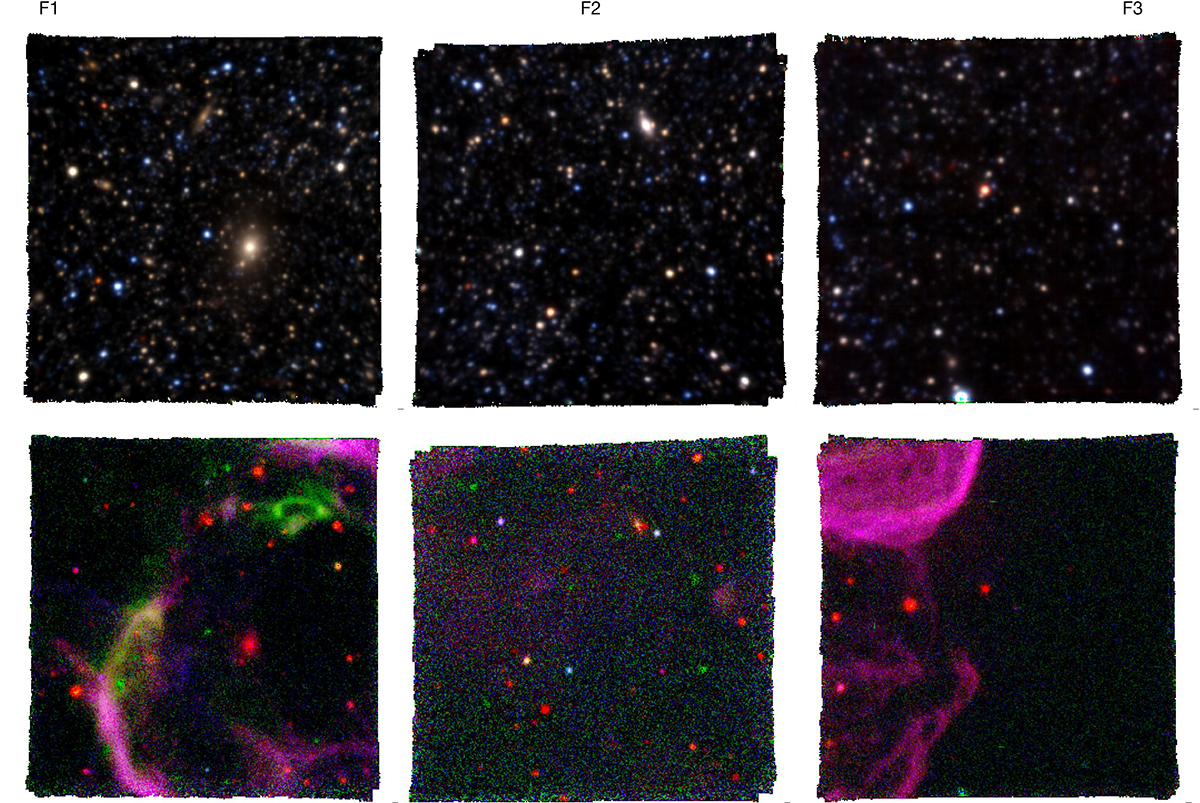
Fig. 2.
Download original image
Broad- and narrow-band images obtained from the MUSE data cubes. Top row: Combined images in the VRI-bands highlighting stellar sources and background galaxies. Bottom row: Combined images highlighting the emission-line ionised gas with Hα coloured in red, [SII] (6713 Å) in blue, and [OIII] (5007 Å) in green. In all panels, North is up and east is to the left.
Current usage metrics show cumulative count of Article Views (full-text article views including HTML views, PDF and ePub downloads, according to the available data) and Abstracts Views on Vision4Press platform.
Data correspond to usage on the plateform after 2015. The current usage metrics is available 48-96 hours after online publication and is updated daily on week days.
Initial download of the metrics may take a while.