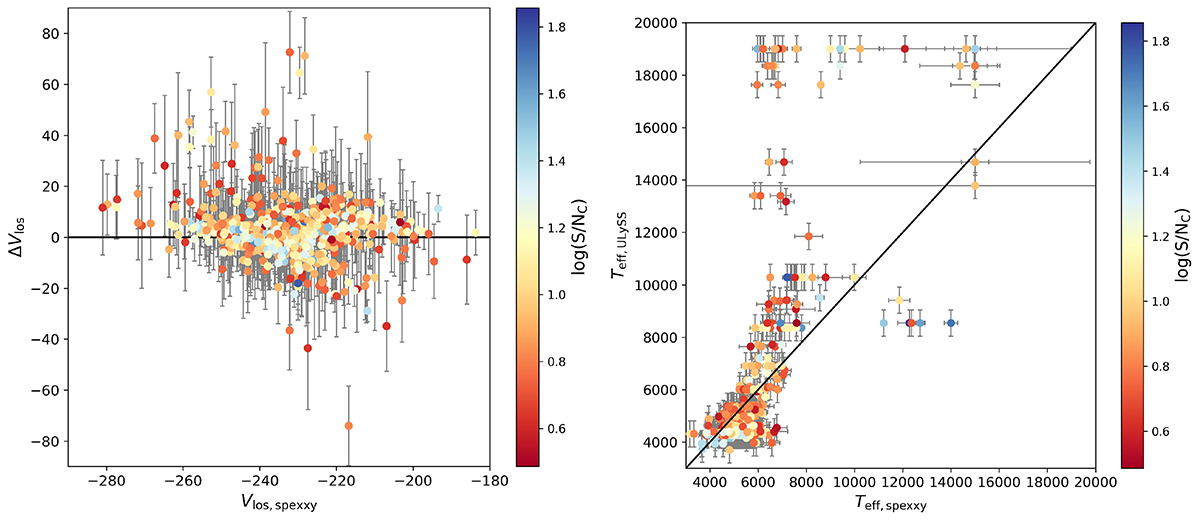
Fig. B.1.
Download original image
Comparison between SPEXXY and ULySS. Left: Velocity differences for pair measurements obtained with the two codes. The solid black line represents the zero velocity offset. Filled circles are colour-coded according to their S/NC, while the grey error-bars indicate the combined uncertainty, that is ![]() . Right: Direct comparison between the effective temperature values obtained with the two codes; the solid black line is for reference only.
. Right: Direct comparison between the effective temperature values obtained with the two codes; the solid black line is for reference only.
Current usage metrics show cumulative count of Article Views (full-text article views including HTML views, PDF and ePub downloads, according to the available data) and Abstracts Views on Vision4Press platform.
Data correspond to usage on the plateform after 2015. The current usage metrics is available 48-96 hours after online publication and is updated daily on week days.
Initial download of the metrics may take a while.