Fig. 1.
Download original image
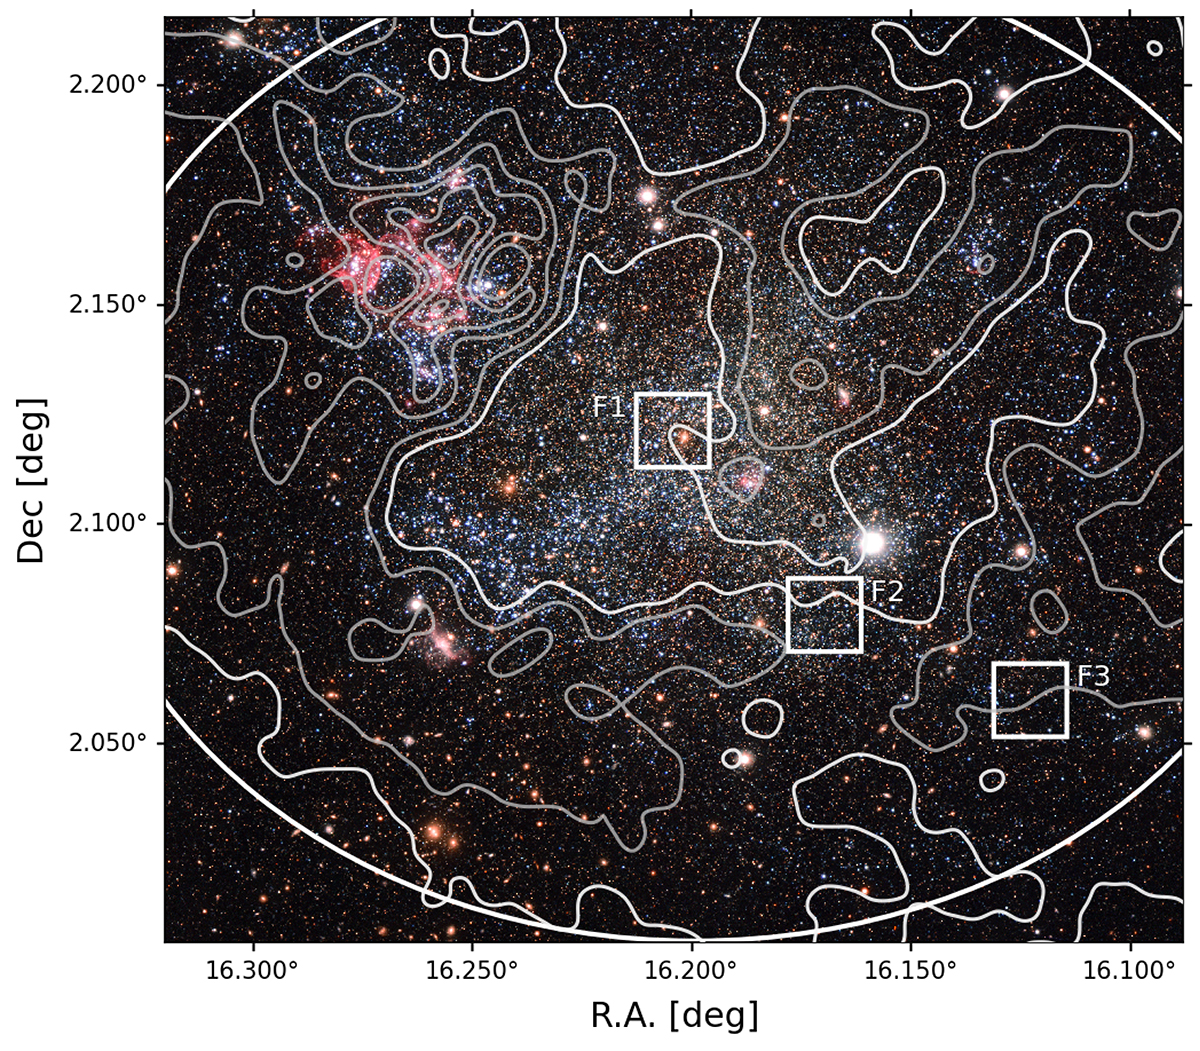
Finding chart showing the location of the three MUSE fields, marked as white boxes, overlaid over a wide-field image of IC 1613 (Credit: ESO – VST/Omegacam Local Group Survey). The white ellipse marks the half-light radius. The smoothed HI column density map from the Little-THINGS survey (Hunter et al. 2012) is marked with logarithmically spaced isodensity contours (silver lines) starting at 3σ (white-smoke lines). North is up, east to the left.
Current usage metrics show cumulative count of Article Views (full-text article views including HTML views, PDF and ePub downloads, according to the available data) and Abstracts Views on Vision4Press platform.
Data correspond to usage on the plateform after 2015. The current usage metrics is available 48-96 hours after online publication and is updated daily on week days.
Initial download of the metrics may take a while.