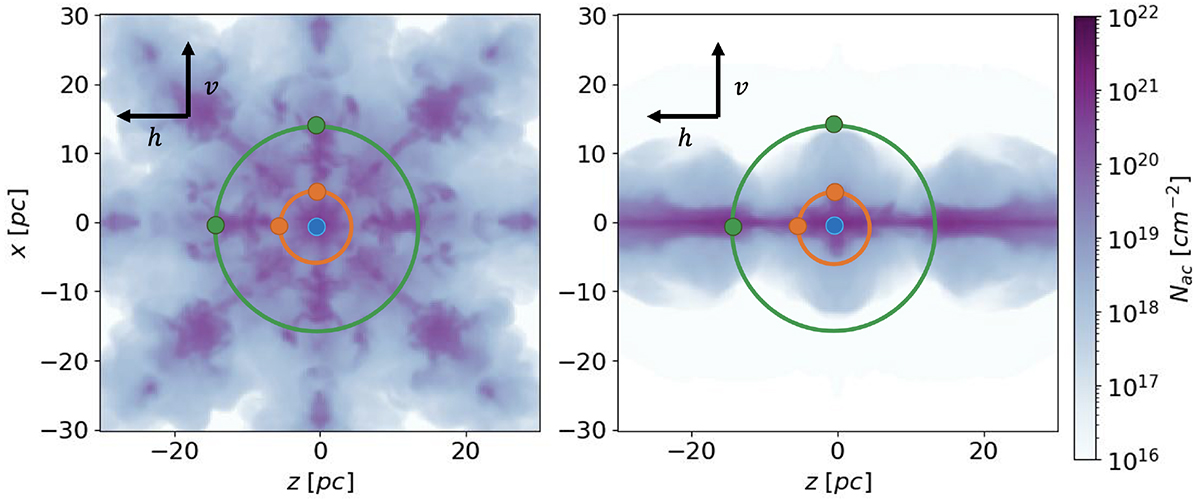
Fig. 9.
Download original image
Zoom-in of the down-the-barrel column density map of cloud material in simulation R32-AL (left) and R32-TR (right) at t/tcc = 1.7. This figure shows on the xz plane the points at which the spectra shown in Figs. 10, 11 and 12 are computed. The blue dot marks the centre of the cloud, the orange circle the region at 5 pc from the centre and the green one the region at 15 pc. In both plots, the top left-hand corner indicates the ‘v’ direction, which we refer to as x-axis, and the ‘h’ direction, which we refer to as z-axis.
Current usage metrics show cumulative count of Article Views (full-text article views including HTML views, PDF and ePub downloads, according to the available data) and Abstracts Views on Vision4Press platform.
Data correspond to usage on the plateform after 2015. The current usage metrics is available 48-96 hours after online publication and is updated daily on week days.
Initial download of the metrics may take a while.