Fig. 6.
Download original image
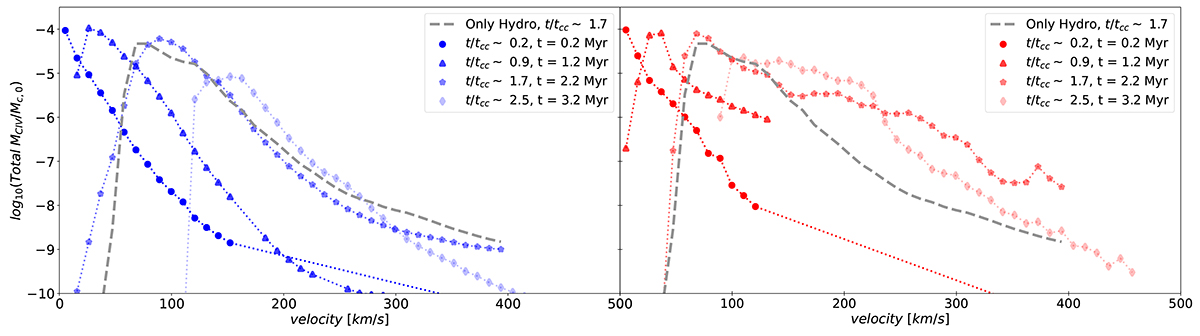
Histograms with velocities (in the x-axis) and the ratio between the total mass of C IV, MCIV, and the initial cloud mass, Mcloud, 0 (in the y-axis), at the same times as in Fig. 5, t/tcc = 0.2 (circles), 0.9 (triangles), 1.7 (stars), and 2.5 (diamonds). We show in blue (left panel) the results from the simulation R32-AL and in red (right panel) the results from R32-TR. The dashed grey line refers to the R32-HD at t/tcc = 1.7. We highlight that C IV covers higher mass fractions than C II and O VI (Figs. 4 and 8, respectively). Also, for t/tcc ≥ 1.7, model R32-TR shows larger mass fractions of C IV at velocities > 200 km s−1 than model R32-AL, indicating a transverse magnetic field favours a more kinematically rich intermediate phase than an aligned field.
Current usage metrics show cumulative count of Article Views (full-text article views including HTML views, PDF and ePub downloads, according to the available data) and Abstracts Views on Vision4Press platform.
Data correspond to usage on the plateform after 2015. The current usage metrics is available 48-96 hours after online publication and is updated daily on week days.
Initial download of the metrics may take a while.