Fig. 5.
Download original image
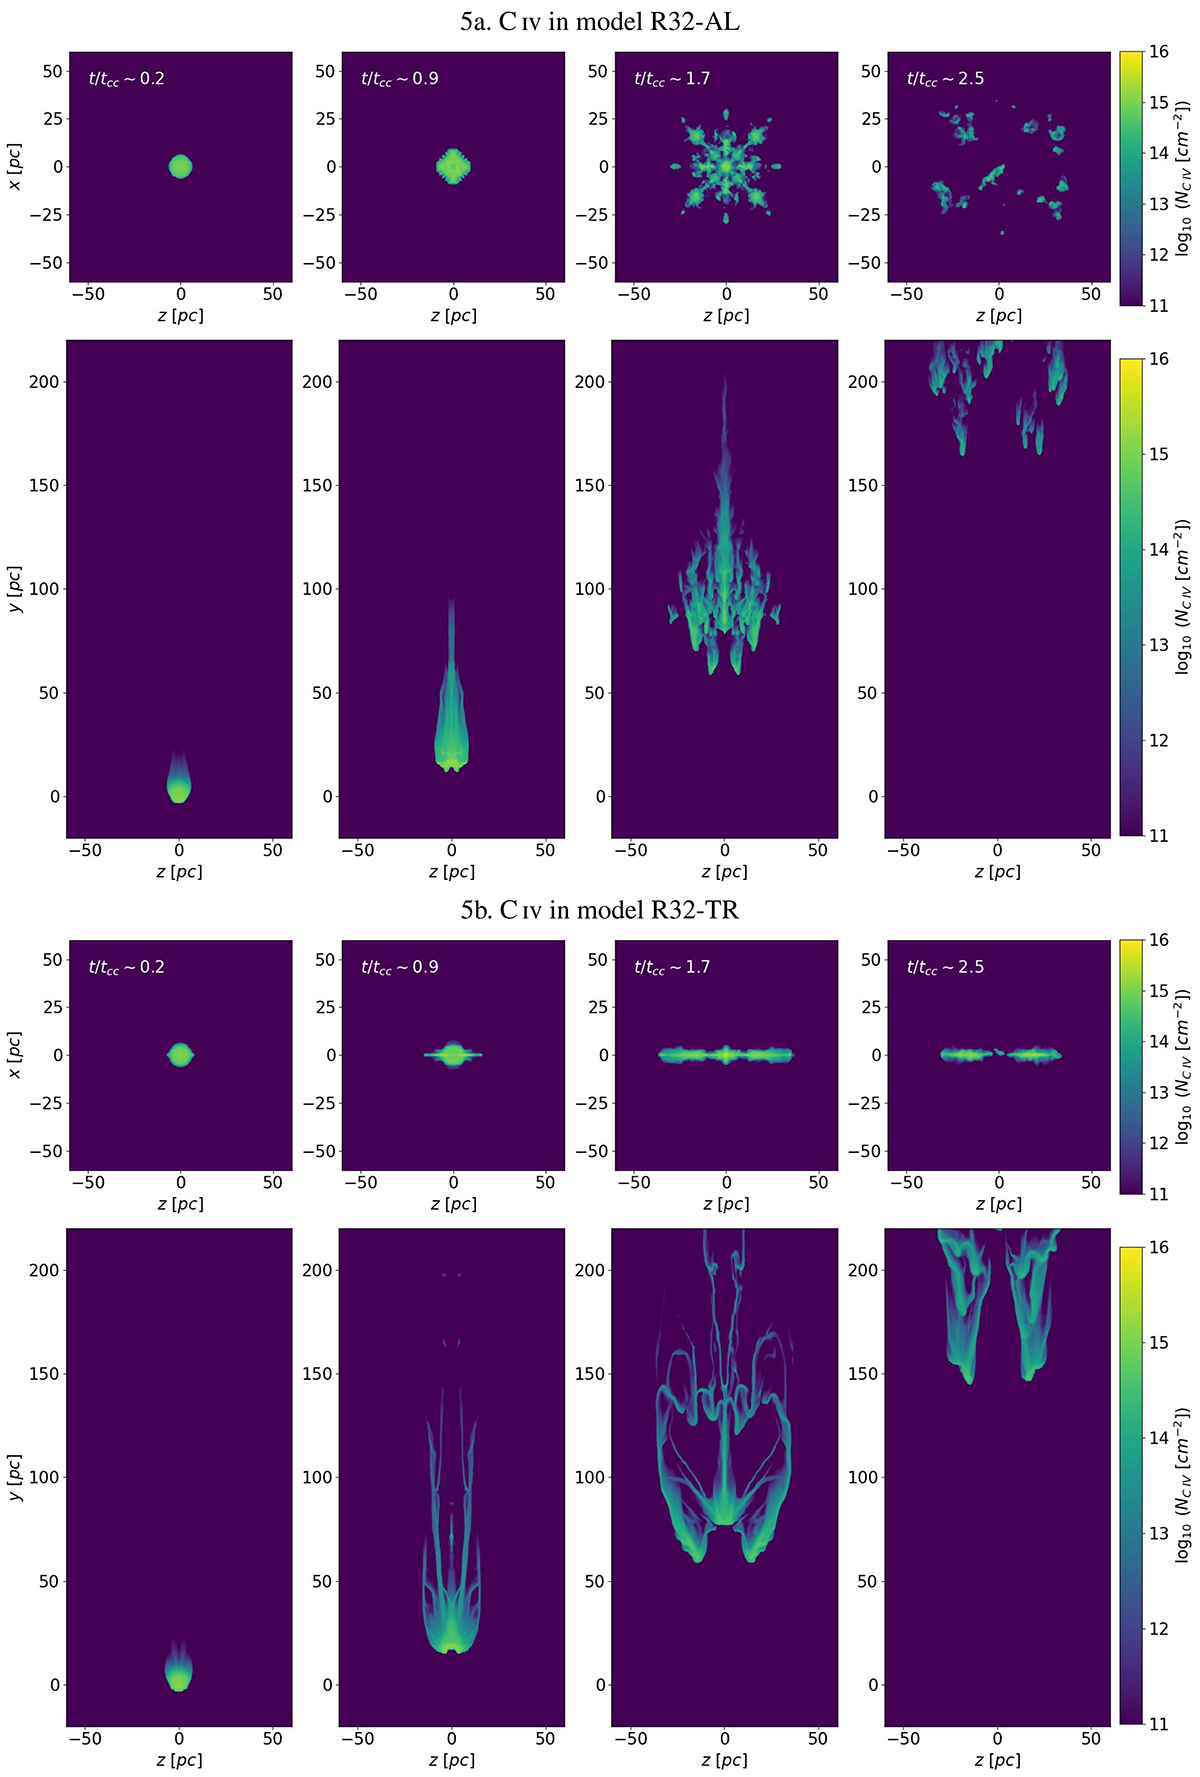
2D maps showing the column densities of C IV. Panel 3a shows the projections for R32-AL simulation along the y-axis for down-the-barrel images (top) and along the x-axis for edge-on (bottom). The same for the model R32-TR in panel 3b. From left to right, the plots display C IV column densities at t = 0.2, 1.2, 2.2 and 3.2 Myr (or t/tcc = 0.2, 0.9, 1.7, 2.5) respectively. We notice that C IV follows a more extended volume of cloud material than C II (which mainly tracks the core), including both the cloud core and the tail. As for C II, also the C IV column density morphology is affected by the different orientation of B, maintaining an extension smaller that 10 pc along the x-axis in R32-TR due to draping.
Current usage metrics show cumulative count of Article Views (full-text article views including HTML views, PDF and ePub downloads, according to the available data) and Abstracts Views on Vision4Press platform.
Data correspond to usage on the plateform after 2015. The current usage metrics is available 48-96 hours after online publication and is updated daily on week days.
Initial download of the metrics may take a while.