Fig. 4.
Download original image
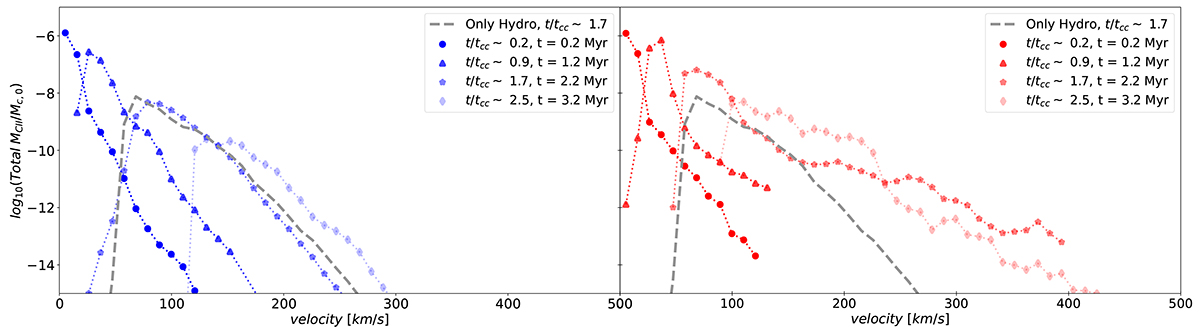
Histograms with velocities (in the x-axis) and the ratio between the total mass of C II, MCII, and the initial cloud mass, Mcloud, 0 (in the y-axis), at the same times as in Fig. 3, t/tcc = 0.2 (circles), 0.9 (triangles), 1.7 (stars), and 2.5 (diamonds). We use the same colour coding of Fig. 2, by showing in blue (left panel) the results from the simulation R32-AL and in red (right panel) the results from R32-TR. The dashed grey line refers to model R32-HD at t/tcc = 1.7. In model R32-TR, at t/tcc > 1.7, a larger fraction of C II mass reaches velocities > 100 km s−1 than in R32-AL. Models R32-HD and R32-AL show similar trends, so transverse magnetic fields produce stronger kinematical effects on cold gas.
Current usage metrics show cumulative count of Article Views (full-text article views including HTML views, PDF and ePub downloads, according to the available data) and Abstracts Views on Vision4Press platform.
Data correspond to usage on the plateform after 2015. The current usage metrics is available 48-96 hours after online publication and is updated daily on week days.
Initial download of the metrics may take a while.